One of my favorite things about soccer has always been how messy and imprecise it is. Soccer is hard. Scoring events are rare and can happen for any number of reasons based on any number of events, events which can be full of skill and genius and vision, and others that are mostly dumb luck, or worse… superstition if you’re into that sort of thing.
I’ll quickly contrast it with an American sport many are more accustomed to. In the NBA, there are roughly 100 possessions per team per game, and 85 shots per team per game, and teams average 46% shooting (105 points per game). So 85% of possessions end in shots. And around half of those possessions resolve themselves with the scoreboard changing, the possession changing, and the ball going to the other team. While each individual point in basketball is certainly “worth less” than a goal in soccer, each and every possession in the NBA is important because of its high probability of resolving itself through a permanent change in the score. Once that point goes up on the board, it’s not coming off (basically).
Because of this, in my past life when I was a fan of ACC basketball, I found the intensity level to be outrageously high. For every ball that went out of bounds, it was critical in my fan eyes that the call be made correctly, because each and every one of these calls had a high % likelihood to influence the score, and thus ultimately the outcome of the game. If an opposing player took 2.5 steps bordering on 3 after his dribble and it wasn’t called as a travel I would get mad, if the ball deflected off of my team and then the other team, but the other team was awarded the ball, I would get mad. If there was a blocking and/or charging foul at all (very subjective referee calls), I would get mad. Because again, the score changes by an average of over 1 point per possession. All it takes is a handful of bad calls for the score to be irreparably changed in a way that determines the result. And I would be even more upset if my team was playing on the road, where I knew the crowd was likely to influence the referee’s decisions.
One big reason I love soccer is that it’s the opposite of all that. While the referee has a very difficult task in a soccer game (covering all that ground, making split second decisions of which team should have possession, determining whether a keeper got a hand to a shot and therefore requiring a corner kick instead of a goal kick, all that stuff), each individual decision he makes normally does not impact the scoreline because of how rarely a possession is resolved by a change to the game score. The average team in MLS takes 12 shots in a game (a shot every 6 or 7 minutes) and might convert 1 or 2 of these into a goal over 90 plus minutes. On the vast majority of possessions, the team fails to get a shot off, and in the limited few possessions where by luck or skill, a shot is created, the vast majority of them fail – maybe the shot is off target or it’s blocked by a defender, or it’s saved by the keeper. It *takes something cool and/or weird* for a goal to be scored in soccer. It’s rare.
So if for instance, the ball is kicked out of play at midfield and the referee gets the team possession decision wrong, the chances of this poor call unfairly impacting the aggrieved team are so minor that it hardly seems like an injustice. You might hear the crowd shout for a second, but they quickly get over it. That’s because scoring a goal is hard, hell creating a shot is hard in soccer. And so it’s really hard to — with a straight face — claim that a possession call that went the wrong way at midfield *caused* your team to concede a goal. I love this about soccer. It’s a really underrated zen element of the game, because even if you know for a fact a referee decision is incorrect, there are only a handful of limited situations in which these decisions do harm the outcome of the game. Even a decision like an incorrectly awarded corner kick when it should be a goal kick for the other team is a shrug — corner kicks result in goals less than 3% of the time, so you can’t even really stay mad. Even if a goal is scored on the resulting corner, it’s easy to come up with a reason why your team should’ve defended better anyhow (whereas in the NBA, the Warriors might have been wrongly awarded possession and Steph Curry will just bury a 3 pointer on you, and those 3 points are forever etched into the history of the game and the result of the game.
There are a couple really good side effects of this peculiar situation. The biggest one is that (here we go) prior to the implementation of Video Review most referee decisions simply are not discussed, not for more than a second during the game, and often not at all after the games are concluded. Corner kicks that should’ve been goal kicks, fouls at midfield that were soft — most of these simply do not matter. And this is great because arguing about the rules and about referee decisions sucks. Bears repeating. Talking about referee decisions SUCKS! Dissecting and litigating the words that define what a careless foul is vs a reckless foul.. it’s just.. I’d just rather be talking about what happened on the field. Next, a fan I can experience the game mostly in a more zen state. I might let the referee hear that I disagree with him on a call – but only in fulfilling my duty as a fan. I can let most decisions slide, simply because chances are the ball will turn over in possession some time in the next minute and my team will have the ball again mostly unharmed (and if they can’t get it back it’s their own damn fault) – contrast that with the constant anxiety and stress of a basketball game where the scoring is being changed permanently every minute.
But perhaps my favorite thing related to soccer and the rules — at least the old rules — was that once a referee made a decision, it was done. You really had no choice but to just move on as a fan, and the refs were empowered to take full responsibility of the calls. And more importantly, the commentators had no choice but to move on – because the game will leave them behind if they dally on a questionable call. This is important. I want the commentators talking about the game and not the calls. The commentators are bards not judges. They’re narrators, not lawyers. And I guess, they’re occasionally #TVpersonalities. And if that’s the case I want that personality applied to the game, not the rules.
Contrast this with the NFL, where the teams can call for stoppages in the game in order that the most recently resolved play be re-evaluated to ensure the correct call was made on the field. In truth, rather than empower the referees with responsibility, referees in the NFL have changed the way they call the games, knowing for instance that if they do NOT blow the whistle on a fumble (even if they believe the runner was down by contact and so the play should stop), the review system will have an adequate chance to overturn the play and ensure justice is done to both teams. They use the system as a crutch and purposefully do not call the game as they see it. And in an already stop-and-go intensive sport, challenges and reviews take up significant chunks of time and kill the flow of the game (but do in fact generate ad revenue for the owners). In trying to ensure every call on the field is 100% correct, they have – in my opinion – significantly harmed the game itself. NFL Commentators on the other hand *love* to talk on and on about the plays being reviewed, the review mechanics themselves, their opinions of the review mechanics, the degree of clarity to which any given replay reveals the truth of what took place on that particular play. They love to talk about the definitions of “indisputable” and the difference between a play “standing” and being “confirmed” or “overturned.” They’re really interested in what a “catch is.” These are all things I do not want to talk about and don’t want to hear about. They are not interesting things. But I suppose the commentators have to discuss them because the game is 100% stopped and nothing else is happening but the review at that moment in time.
So back to soccer, this free flowing, no commercials, zen-like sports paradise. I should pause for a second to acknowledge that there are some very big referee decisions that have to be made from time to time, and that these decisions while rare, do impact the outcome of the game to a significant degree. So much so, that research has shown homefield advantage to be largely the result of referee decisions going in an unconsciously biased direction due to crowd influences. And it is these decisions, the penalty call or the no-call, the red card or yellow card, that are from time to time discussed at length immediately after the matches because they do impact the outcome of the games – either by permanently altering the score line (penalty in the box) or by changing the nature of the game itself (in the case of a sending off). I’ll add that discussions about these critical calls very rarely extends beyond the post match reporting in areas of the world where soccer is dominant.
I understand the sentiment that one might want to put something in place to aid referees in getting these calls right more often than they currently do (which by the way, in my opinion is an extremely high success rate when one considers what they’re tasked with and how difficult it is). But I don’t think this “something” should be one that creates loads of discussion and controversy in real time or even shortly after. I do not want the referees slowing the game down, following a big moment so that someone from upstairs can whisper into their ear whether or not to officially pause the game to then walk all the way across the field over to the booth to then review the video that the guy upstairs is already watching, and then to walk back and to issue a judgment.
So whatever we choose to provide to referees to aid them in getting the big decisions right, it has to avoid lengthy game stoppages and really to be a success, whatever it is should go unnoticed. I don’t want to talk about it and I don’t want the managers and the players to talk about it. And I really don’t want the commentators to talk about it.
One other observation as a fan who has witnessed VAR live several times now at Mercedes Benz Stadium. When your team scores a goal it’s really fun. What normally happens is you freak out for a half second, check the AR for offside, then freak out for a few seconds then look around for friends and family to celebrate with, then after that you look for strangers to high-five. Because goals are so rare, the tension and excitement really explodes in these moments.Similarly, when the opposition scores in soccer, it is gutting and that’s part of it. The great thing is that at home the crowd can lift the team who has just conceded as the ball is being walked back to the center circle, and once the ball is back in play, it’s a nice reset. You get to move on. You get to watch the game again and you think forward instead of about what has just happened. Because there’s very little stoppage after a goal, the game forces you to pick yourself up and get on with it, and this is a very underappreciated element of soccer. In my experience VAR has begun to ruin all of this. It ruins the celebratory moments (as I’m cautious to be too happy after the goal) and extends the defeated moments (instead of getting on with it, I stand there hoping the referee will be called over to review the goal in the video booth to overturn it).
Limit VAR’s application to red cards
2 directions
All red cards given out by the CR should be reviewed in the booth to ensure the structure of the game has not been catastrophically altered by a mistake (or a mistaken identity). When a red card is handed out, there is already a natural pause in the game as the referee has some administrative work to do and some general defense arguments to hear from the aggrieved side, and he has to make sure the player is sent off. It is also not uncommon for the physios to run out and check on a player who may have been tackled as part of the incident. So given there’s already this pause and it’s a very important decision that has to be made (and one that is already disrupting the game), it could be checked up in the stadium somewhere by way of Video Review (without the CR having to run over to an on-field booth). Once the review is complete (and it should be fast because the referees decision should stand unless it’s immediately clear he has made a mistake), the player goes to the locker room or is waved back on.
That still leaves us with the naughtier incidents where a player needs to be sent off but it hasn’t been spotted by the CR or a yellow was given in place of a red. For these situations, I suggest that the play resumes without pause (as it would have to, the referee having not seen the incident), and at any point the VAR center up in the stadium somewhere can signal down to the referee that they’ve seen a clear red card offense and that Player X has to be sent off. At that point, the referee waits for the next dead ball, then blows the whistle, shows the card, explains it to the player and to the captains and makes the signal to the crowd that it came from the booth. No unnecessary stoppage in play. Most egregious off ball incidents get sorted out this way. And the game is only irreparably harmed when it must be in accordance with the Laws of the Game.
“But what about the penalty decisions and the goals?” you ask.
Simply put, they are matters of judgment that the referee and his team have to get right as best they can. And they should be called live with no look-back provisions. If anything, the CR and the AR need to do a better job of communicating before the goal signal is called. Goals called on the field should be goals, penalties penalties, and no calls no calls. And most importantly, the referees should continue to have the complete discretion that is required to get these calls right on the field. No leaning on video replay for offside decisions by keeping the flag down. No swallowing the whistle on goal scoring situations knowing that VAR awaits. Make the calls as you see them, make the calls final, put authority back into the hands of the referees, and we’ll be most of the way there. And importantly, we’ll move on quickly when inevitably there are mistakes.
Funny story is I found this post mostly written from the fall of 2017 in my drafts folder. Since everyone was talking about VAR this week, thought I’d get this out there and put it to rest. In all honesty, I wish no one would ever write or produce anything about referee decisions or the Laws of the Game ever again. There’s too much other cool stuff going on.
If you find me yelling about VAR on twitter just tell me to shut up.
There’s maybe a future Yamil Asad appreciation post to be .. posted, but until then I tweeted some stuff (a thread) on his defensive stats. What I want to talk about today is something different, something less statsy.
It’s a quick post to talk through the Yamil Asad transfer stuff, and perhaps explore just how fluid and complicated roster building can be in MLS. I’m going to piece together some quotes from stuff published elsewhere and for this exercise we’ll take them all at face value to see if it all adds up and what we might learn. Quotes from the source material (AJC, ATLUTD.com, etc) are further below.
My stab at a summarized timeline for this off-season’s transfer saga(s) might go something like this:
In August 2017 (mid-season), the club identified Barco as a key target and met with Independiente in September and began negotiations for a transfer.
End of 2017 Season (October): Club offers Asad a 3 year deal, upwards of $300K/year. And we can piece together that the club likely would have either been working with an already known purchase option with Velez, or one negotiated along a similar timeframe. We’ll use the ultimate fee agreed between DCU and Velez as a proxy for what Atlanta presumably would’ve paid Velez. It’s right around $1M, which sounds about right based on what was reported previously.
Asad turned down this offer, and other presumably increasing offers during the off-season.
We start hearing some buzz about Carmona returning to Chile (late October)
In late October, when it was clear there would not be a deal for Asad, club reallocated some combination of the budget space / GAM / TAM that would’ve been used on Asad at $1M fee + $300K wages to trade with Portland for Darlington Nagbe (fee of $300K TAM, $650 GAM, + incentives and wages of $565K (unless they gave him a new deal – he had supposedly been wanting $1M for his next contract). Eales is on record on ET Radio as saying the $650K of GAM was “dry powder” from 2017 (implying it was not generated by a sale or future sale of a player. He also says Carmona is not going anywhere – calming my own fears that Carmona would be sold). And perhaps most importnatly, we hear from Boca and Eales about how Nagbe was brought in to be a #8, not a wide player. Hmm.
On January 10, at the SuperDraft, the club signs Barco – though by all accounts this was contemplated well in advance of the off-season, and with such a low young DP budget charge ($150K), this likely did not affect the rest of the roster build.
In late January the club sells Carmona for $1.5M – with $750K of GAM generated to enhance the budget. Additionally, Carmona’s salary of $700K or so, has an implied annual TAM usage of $200K, so that’s another $200K/year of TAM to play with. All in, this sale probably freed up about $1M of TAM for 2018.
According to Doug, following the Carmona sale, Atlanta went back to Asad with a better offer and he still declined. Who knows maybe this was $350K-$400K?
Early February, Atlanta fields trade offers around MLS and ultimately trades the “rights” to Asad for $500K of TAM to DC United. No rumors to my knowledge about which other teams were interested. But we should assume this was a notably better offer than anyone else since the club would’ve been hesitant to trade with the East, let alone DC who Atlanta play 3 times a year.
Presumably the last step is to use the funds from the Carmona sale and the funds from the Asad rights trade to sign a replacement for Carmona.
I think this is a useful exercise because by laying it all out there in a timeline, a couple things become clear, and other stuff unclear:
Atlanta United initially wanted BOTH Asad AND Barco. This is either because they wanted Asad as the first player off the bench, OR they imagined Almiron dropping deeper in central midfield to play alongside 1 of Carmona/Larentowicz with Asad – Barco – Villalba behind Martinez. That’s a bfd imo.
Nagbe was not in the team’s initial plans for the off-season (neither as a center mid, nor at all). This is important as it relates to the general shape of midfield. This idea we’ve been discussing in atlutd world that from the beginning of the off-season, the club wanted to transform the way it played in the center of midfield is either incorrect or it was correct BUT with the added wrinkle that they imagined Almiron dropping back as the way to achieve that goal.
The fact that once Carmona was sold they again offered a deal to Asad suggests that in terms of priorities, depth in (a now thin) deeper midfield is second to securing Asad or a similarly valuable attacker. Again, it’s either because at this point they think Jeff + Nagbe is fine and would prefer to split available resources between a depth CM and a depth attacker, OR actually who knows? this starts to break down, but I was going to suggest maybe there’s still a chance they want to bring in an attacker and play Almiron in midfield (Nagbe as depth). Then again, Nagbe is a starter. Period. Right?
Just in terms of funds available. This timeline alongside the news of all the new discretionary TAM and all that suggests that the money was always there to sign Asad. He’s at DCU now because of a fundamental disagreement about his market value, not as much because the club couldn’t make slightly higher wages work in MLS budget context. Basically if they had the money for Nagbe, then they had the money for Asad.
Something definitely seems off though still. Something we’re all missing. Could it be a formation tweak? I’m not sure, but I don’t think we’ve necessarily uncovered it yet. Excited to see who they bring in next.
Atlanta United approached him before the end of the season with a contract offer of three years guaranteed and an annual salary of at least $300,000. Asad wanted significantly more.
Atlanta United approached Asad several more times in the offseason, to no avail. When it became clear that they couldn’t sign him, the team used the funds to acquire Darlington Nagbe in a trade with Portland.
After Atlanta United sold Carlos Carmona in January, the team made one more attempt to sign Asad. Atlanta United offered another multi-year guaranteed contract with an increased annual salary. He wanted either more salary or a shorter guaranteed contract. Atlanta United declined and began to receive trade offers for Asad’s rights from several MLS teams.
According to an ESPN report, D.C. United will pay Velez Sarsfield $300,000 with an option to make the loan permanent for $700,000.
There were a couple guys we considered that we thought could come from within the league and make a difference in our midfield. The others would’ve probably forced Miguel Almirón a little deeper in the middle, and we didn’t want to take him further away from goal. So Darlington fits our lineup perfectly. Whether he’s deployed centrally or on the wing – he will chip in with a few goals and assists but he’s going to be the connector. He had one of the highest possession retention rates in the league, which is perfect for our team and style building out of the back and playing through the lines. He’s the exact piece that we wanted, and we were honestly surprised that he was available. So we’re excited we were able to get him.
With Darlington, we don’t expect him to be a #10 so to speak, because that would push Miguel deeper or out wide. He has a good engine, he’s calm and smooth on the ball. You can fire him the ball while he’s in trouble and he’ll get out of it with possession and keep the flow of the game going. We see Darlington as someone who is going to bring other people into the game and make all the players around him that much better.
“Darlington’s a player that fits our team very well and fits the way we’re trying to set the team up,” Eales said. “He’s attacking, he’s exciting, and he’s a facilitator and a connector.”
“We got a player who’s one of the top players in MLS but also someone that was different to what we had in the team already,” he continued. “The attributes and skills that Darlington has compliments our firepower that we have up front. With Darlington behind Miguel Almirón, Josef Martinez, and Tito Villalba pulling the strings, I think it’ll see our offense go to a whole new level.”
“We sat down and said who do we like in the league that in an ideal world we could get on the team. One of the first names is Darlington, but you don’t think you’re going to have an opportunity to trade for him. Then circumstances happen and we had that chance and we were ready.”
Here’s a draft of the Nagbe article posted over at DirtySouthSoccer. Posting it here just so I’ve got it here, and also cuz it was just sitting in the draft folder.
I've learned it's important to make snap judgments you'll regret later on this website.
By now you know the big news. That Atlanta has struck a deal with Portland Timbers for 27 year old USMNT wide/central midfielder Darlington Nagbe in exchange for $650K of GAM and $300K of TAM in 2018, $100K of GAM in 2019, and $600K of additional allocation money contingent upon Nagbe’s and ATLUTD’s performance during his contract term, and a 2018 international spot.
This is exciting and I have a bunch of questions. This post is going to explore these questions and attempt an objective evaluation of Nagbe as a player, as a fit for ATLUTD, and as a transaction in MLS. Put another way I’m going to try to answer the question: Why Nagbe?
I think the first question on everyone’s mind (especially as the roster continues in a state of flux between the inaugural season and the upcoming 2018 campaign) is: was Nagbe brought in to play from a wide attacking position or from a more central box-to-box role? According to whoscored, Nagbe started 22 matches out wide (16 left), and 7 times from a central midfield spot. From 2013 – 2017, 125 (77%) of his 162 starts have come from wide positions, and 27 (17%) have come from the central midfield role. Also 10 appearances in a #10 role.
Here’s Carlos Bocanegra from the official team site: “Darlington is one of the most dynamic players in the league, and what stands out to me about him is that he compliments our attacking options so well. He has the ability to dribble out of trouble, he has a very unique quality in his ability to skip past a few defenders and drag defenders out of position, which leaves his teammates in great positions one-on-one or with mismatches down the field.”
He continues: “There were a couple guys we considered that we thought could come from within the league and make a difference in our midfield. The others would’ve probably forced Miguel Almirón a little deeper in the middle, and we didn’t want to take him further away from goal. So Darlington fits our lineup perfectly. Whether he’s deployed centrally or on the wing – he will chip in with a few goals and assists but he’s going to be the connector. He had one of the highest possession retention rates in the league, which is perfect for our team and style building out of the back and playing through the lines. He’s the exact piece that we wanted, and we were honestly surprised that he was available. So we’re excited we were able to get him”.
While the “What Darlington Nagbe brings to the 5-Stripes” video is just a compilation of goals he’s scored, I agree with many others who have written about the signing in that I don’t think that’s why they signed him.
By all accounts Nagbe’s strengths are in passing, ball retention, and carrying the ball through lines of defenders in midfield.
Dribbling
I thought I would check some of these conventional wisdoms against the stats and pulled some individual player stats from whoscored.com and started sifting through them. This chart, which includes players with 800 minutes or more and who played primarily in midfield (as broadly defined, think center mids, wide mids and 10s) caught my eye:
Did you find Larentowicz and Carmona? Hint, fly Southwest.
While one might not expect for Larry and Carmona to be taking players on 1v1 from the central midfield areas, I think it’s telling that even compared to other midfielders like Ring and Bradley and Chara, they are on an island all alone called zero. It’s plausible that Tata identified this as an area of improvement for his midfield, the ability to eliminate defenders on the dribble to open up high quality passes into the final third or throughballs in on goal to Martinez and Villalba. There are three Nagbe dots above, his overall average, his average playing wide, and his average playing centrally, where I think we can expect to see him for Atlanta United, and they’re all quite good. While his dribble output is the highest in wide spaces (makes sense), even in a more central role, Nagbe is successfully dribbling by defenders more often than once per game and he’s completing dribbles right around 70% of the time, which is a better rate than player’s like Villalba, Almiron, Schweinsteiger, Blanco, Asad, and Lodeiro. This seems like it could be a positive addition to an Atlanta United midfield that frankly I didn’t see much in the way of weaknesses in 2017.
Passing
By the numbers, Nagbe is a better passer than maybe anyone else in MLS. By now you’ve certainly heard the soundbite about him leading MLS in passing at 92% accuracy. While this is an intuitive data point, a flat pass completion % is often misleading. What if the player only attempts easy passes? Luckily, there are other metrics we can use to take a stab at evaluating passing ability. AmericanSoccerAnalysis.com has developed one such metric, which they call xPassing. By comparing all of a player’s pass attempts against the average success rates for similar pass attempts across the entire league in previous seasons, they develop an “expected passing percentage” for each player based on the passes he’s attempted. If a player’s actual pass accuracy % is greater than the calculated expected passing percentage for the profile of passes he attempts, than he is an above average passer. I took ASA’s data, which is categorized into final third passes, middle third passes, and defensive third passes and dropped them in excel.
To start, I filtered on only players with greater than 700 “middle third passes” and charted their success rates above or below the expected rates on the y axis (at the top of the graph are better passers and at the bottom the worse passers), and on the x axis I’ve plotted the average xPass % (players who on average attempt easier passes are on the left, and more daring passers are on the right):
You can see that while Carmona and Larentowicz are above average passers, Nagbe towers above everyone, a true outlier. Also, Carmona is a bit of an outlier in terms of attempting almost exclusively high percentage passes. Nagbe is closer to Carmona than to Larentowicz in terms of passing profile (passes that are historically completed at a higher rate). For grins, check out Asad (lower left) who as we might expect takes huge chances with riskier passes. The models have him coming in lower than one might expect, and I won’t argue with it, except to say you make your own luck. Watching Asad in 2017 was so thrilling because he would try literally anything and when surrounded by goal scorers, this has its benefits – and he saw those benefits with monster assist numbers.
Nagbe pops even more if we look only at passes in the final third. The chart below includes all MLS players with 300+ final third passes.
Again, Nagbe is in a league of his own in terms of passing accuracy in excess of expected pass accuracy based on historical averages for similar passes in the final third. He’s also in the upper tier in terms of choosing less risky passes. So in terms of passing, it is true that whether he’s in the middle third or final third, Nagbe chooses to play exceedingly high percentage passes and he completes those passes even more routinely than they are typically completed. He appears to be a good passer, and probably a better overall passer than a chance creator.
Ball Retention
One thing that not taking on defenders in the central midfield areas gets for you is somewhat higher ball retention rates (Carmona and Jeff high-five each other). If we’re going to have old Darlington dribbling around in midfield, let’s make sure he’s not a turnover machine like the beloved Asad (who fortunately for ATLUTD, turned the ball over further up the field). Charting the sum of “unsuccessful touches” and dispossessions” per 90 minutes from whoscored on the y axis and average number of passes per 90 on the x axis, we get the following for “midfielders”:
Upper left are players who turn the ball over at a higher rate per touch, and players lower right care for the ball like a baby bird. So the usual suspects show up on the high turnover end of things, the attacking midfielders and wide players. Of note for our purposes are Asad and Almiron in the 4+ p90 range. Poor Johan Vinegas isn’t even pictured above because I had to cut off the y axis (10.2 turnovers p90!!!). And also of note, Nagbe shows up in the 3-4 range when playing wide, but only the 1-2 p90 range on 56 average passes, when playing centrally. He profiles similar to a Carmona or an Alexander Ring when he plays there, and that’s good. For reference, Larentowicz is at the absolute midfielders’ league floor of 1 per 90. Good old Jeff. Michael Bradley shows up impressively giving the ball away under 2 per 90 despite averaging 77 passes p90. These figures make me feel a little better about having a fancy dribbler guy in midfield.
Chance Creation
Much of the talk of Nagbe’s qualities has focused not on his final third product but more on buildup figures and his unique abilities to move and retain the ball. There’s a reason for this, he only registered 3 goals and 3 assists in 2017 and his underlying xG and xA numbers were even lower at 1.95 and 1.23 respectively (according to @analysisevolved). Most everything points towards his value being in buildup and not in chance creation. Here’s a chart of MLS midfielders’ key passes and shots per 90 minutes (minimum 800 minutes):
To me, this is informative because while Nagbe’s 2017 minutes at central midfielder were limited, he put up key pass / shot volume profiles that were more attacking than the household central midfield names like Bradley, Dax, Alonso, Ring, and also Atlanta’s Carmona and Larentowicz. He basically put up key pass numbers that looked like a decent attacking midfielder but shot volumes that looked like a #6. Schweinsteiger was a good comparable in 2017 in terms of chance creation. It strikes me that this “link up” / “connecting” player we keep hearing about that Nagbe will be in Atlanta… there just aren’t many examples of this type of player in MLS, partly because its such a unique profile. That’s somewhat worrying if only because it’s hard for me to completely visualize how 2018 will look in an average match. But it’s also a reminder that Nagbe is a rare talent — I just can’t think of many “connecting” midfielders in MLS who dribble and pass with ease and play behind the #10. Nagbe’s unique mix of skills is very rare, and so it make sense that you’d have to pay for something this rare. We’ll get to that later.
Quickly on Shot Selection
If there is one area of Nagbe’s game I’m confident he needs to improve, it’s his shot selection. Here are the shots per 90 (“inside the box” on the x axis and “outside the box” on the y) for “midfielders” in 2017:
This isn’t completely worrying, but Nagbe doesn’t shoot often compared to other midfielders and when he does it’s from range. These shots are very very rarely high percentage shots. We won’t expect him to contribute very often as a shooter, and it’s not uncommon for a holding midfielder to take a higher percentage of his shots from range, but even glancing below Nagbe in the graphic we can see the other low volume shooters contributing some from inside the box. With so many goal scorers and chance creators playing in front of him in the team, Nagbe will need to pass up the opportunity to have a bite from range and instead feed the ball to the expensive South Americans who create goals.
Chance Buildup
So if Nagbe isn’t a “find the final ball” guy and he’s not a “get on the end of the final ball” guy and he’s not a “shield the back line” guy, I guess he’s the “everything else” guy. AmericanSoccerAnalysis has a metric with which to view a player’s contributions to possessions which end in the creation of a chance. It’s called “xG chain” and it basically assigns value evenly to every action in a sequence leading up to a shot based on the final xG value of the shot. So if Nagbe’s good at linking up plays that ultimately end in good chances, he should still show up with decent xG Chain numbers, even if he’s not involved in the final ball. Similarly “xG chain – buildup” measures the same thing but without considering assigning any values to the final passes or shots. We would expect Nagbe to shine better in this second metric. Anyhow, here are both 2017 xG chain (Y) and xG chain buildups (X) per 96 minutes according to ASA:
Nagbe’s buildup play is on the higher end, in good company at +0.32 in the same ballpark as Kljestan, Victor Vazquez, Mauro Diaz, and Almiron. And unsurprisingly, his overall xG chain isn’t isn’t much higher than his xG chain buildup, suggesting most of his contribution does in fact come in linkup play and not in the final ball. If we’re going to ask him not to creat chances but just to link up midfield and attack, than we’d want him to have a good buildup number, and he does. So that’s good.
Defense
Assessing a player’s defensive value or even defensive contribution using on-ball event data is definitely questionable. Counting-type stats like interceptions and tackles and clearances are mostly descriptive and are almost entirely detached from “value.” A player might tackle more because he’s facing more take-ons, not because he’s a good tackler. That being said, because Nagbe will likely be shifting into a role that he hasn’t played as often in the past, I thought we could take a look at interceptions and tackles, and as long as we keep our “descriptive” goggles on, and don’t get too carried away, maybe it’s worth looking at. Here are tackles and interceptions per 90 minutes for all “midfielders” in 2017:
Remember, the frequency a player tackles or intercepts is often just as much a reflection of how often he is put in the position to make such a tackle as it is a reflection of his ability to break up play. Adjusting these figures for possession would be better, but I don’t know how to do that cleanly. So if we just caveat this to hell and back, what do we see? I’m slightly encouraged by the fact that when Nagbe plays CM he either does (or is asked to do) a similar amount of on-ball defending as Carmona and Asad. None of these guys sniff Larentowicz who appears to be an on-ball defending demi-god of sorts, but at the very least Nagbe is either just as capable of, or has been put in similar situations (albeit in limited appearances) as Carmona and Asad (who is a very high defending wide player). If what many expect to see comes true, and Carmona does indeed drop back into a more 2017-Jeff role, and Nagbe drops into the 2017 Carmona role, it would appear as though he’s not entirely foreign to it (I was surprised to see this honestly).
Also, I should add that Nagbe tackles with efficiency. Pictured below (tackles p90 on the X and tackle success rate on the Y):
He’s… wow.. he’s very good by this metric. Not sure how much stock to put in this, but it pops visually. Cool.
What I’m most concerned about defensively is Nagbe’s ability to find his spot in the high pressure scheme that Tata employs. From watching the games last year, Carmona very often led the high press by launching forward from central areas to squeeze opponents in possession. He may not have collected all of the tackles and interception stats, but he likely caused many of them by initiating the press and funneling the ball towards pressing traps. I haven’t seen enough of Nagbe to feel confident that this is in his game, nor the awareness in a transition moment to jump start the press but I don’t know for sure. Matt Doyle commented on ET Radio that this was not a strength of Nagbe’s game.
Trade Value
Finally, the tricky question: Was the trade worth it?
There are many ways to answer this and lots of factors to consider. First, let’s just conclude quickly that based on the above charts and what not that Nagbe does in fact carry a unique and perhaps even rare combination of highly valued skills. Those skills do not or perhaps have not translated into final third “end product” in the way that most highly valued soccer skills do.
Second, let’s assume a “highest and best use” proposition that Nagbe will in fact play as a “linking player” in a “#8-type” “box to box” role and that Darren Eales and company identified him to fit into this role. Quotes from the team certainly indicate that all of this is true and his lack of chance creation numbers suggest that perhaps he shouldn’t have been playing out wide. Who knows.
Third, I just want to contextualize this some more before we start talking dollars and cents. When I watched Atlanta United in 2017, I don’t think that at any point in any of the games I said to myself or those around me “I wish Jeff Larentowicz played more like Carlos Carmona in the deepest midfielder role and I wish Carlos Carmona played more like Darlington Nagbe in the box2box role.” We can agree that Jeff and Carlos did not complete 1v1 take-ons the way Nagbe can. We can even agree that the extent to which they did not attempt these duels is perhaps low by central midfield standards. And we can agree that Nagbe has another level to him in terms of ball retention in traffic. But it seemed to “work” last year without him, at least in my eyes. And that’s worth pondering.
That all being said, as long as Larry and Carmona are coming back, and we we agree that we needed to add a central midfielder anyways just for depth reasons, Nagbe isn’t a bad type of player to add (Jeff to the bench). On balance, he would likely improve every single team in MLS right now, so that should count for something. Are Atlanta that special?
Further, the advantage that Atlanta United may have had in 2017 in terms of being able to efficiently create a team’s wage budget from scratch without having to navigate existing chunks of budget already allocated to players (and yes this has its downsides) may be coming to an end as a) LAFC rolls into the league with a presumably huge war chest of expansion allocation money to play with and b) all teams were just handed the option to dip into $2.8M in additional TAM per year. So, to the extent that teams were handicapped in 2017 by their past mistakes (bad contracts), 2018 is going to be a different story in which every. single. team. will have the ability to rebuild and improve their squads. It is in this very context that dealing for Nagbe makes sense — the context that says every single team in the league (except DC United and Columbus) will theoretically improve in terms of roster strength and depth, and so because Atlanta will have to as well, you may as well grab a domestic player who is almost entirely unique in his skill set and in the prime of his career.
What about the price though? $650K in GAM now. $300K in TAM now. $100K in GAM in 2018, $600K in contingent fees if Nagbe and ATLUTD hit certain milestones. First of all, when we saw the news of the $650K in 2018, many of us were worried because this is the exact amount of GAM that the team would generate (by rule) if it sold a player out of MLS at decent a profit – so for a moment there, we thought the Nagbe deal meant either Carmona was being sold, or Almiron or Martinez was being sold. And I’m not going to lie, this initial reaction has colored the way I’ve thought about the trade the whole time. BUT, Darren Eales on ET Radio came out and said that actually the GAM that went northwest in this deal was dry powder from the existing expansion year GAM allocation that the team had been saving just in case a huge opportunity like this one showed up.
And by all accounts, this did *show up* — Portland decided to deal Nagbe and started shopping him, and Atlanta was like “what now? I mean, I’ll have to ask my boss, but like… is this a good number to reach you at? And and can you say which player it is again that you’re looking to move? Yea, let me get a pen, it’s Darlington (how do you spell that) Nagbe and not Liam Ridgewell, right. Yea, ok got it. Well, I’ll see what I can do, money is tight these days but I understand where you’re coming from and we look out for each other right”
Sorry
If you’ve kept up with some of my other posts on the finances of building an MLS roster, you know by now that I DO-NOT-LIKE-TRADING-ALLOCATION-MONEY-FOR-PLAYERS. Simply put, when a team does this, it is trading its ability to increase its wage bill above other teams…to another team. It is saying “here, we will pay our team less and you can pay your team more, and in exchange we’ll take your player and we’ll have to pay him with what is now less.” So my immediate reaction was that this was a bad trade. A mistake. I’m now fairly neutral on this (though I am definitely excited to see him play), having been persuaded by a few arguments in favor of the deal:
While sending allocation money to your competition isn’t ideal, in this case, the alternative of finding a player of Nagbe’s quality for $1M + add-ons in the international market is difficult (transfermarkt shows a bunch of “comparable players” in the 2M euro range). And finding a player of Nagbe’s quality for less than that who is only making $565K a year in wages is probably impossible. I should add that Nagbe will get a raise when his contract is up – he wanted $1M from Portland, thus the trade shopping. Because of this, his contract is currently a “favorable” one, an “asset” in accounting talk. If by chance his contract has more than one year left on it (and it appears that this might be the case), than this might in fact be a slam dunk of a trade. A player worthy of $1M making half of that for 2 years running starts to pay for the $1M fee VERY quickly. Now, who knows what Atlanta will do and when in terms of extending his deal and giving him the money he wants, but this seems pretty favorable. Further, paying GAM for a player but using TAM to pay down his wage to the max (and potentially further to free up budget space for other players) isn’t a terrible combination. I’d be more worried about sending a boatload of TAM away to then turn around and use more TAM to keep a player’s wages compliant with the rules.
With all of the new money flowing into the league being TAM (and the rule being that you can’t use TAM and GAM on the same player), the fact that only $300K of this deal is TAM is a positive development. It would appear that the club hasn’t even dipped into the discretionary TAM available, and that this deal won’t hamper the club’s further spending. If it’s true that Nagbe in and $650K of GAM out doesn’t mean another player is headed out (and that the GAM was saved from 2017), that’s good.
Something, Something International Spots? I’m honestly confused about international spots in the new MLS. It would appear that high-end domestic players have suddenly become unicorns with higher valuations than before. And I’m not totally sure why. Perhaps it’s the fact that $64M of additional discretionary MLS fees/wages has just been approved for clubs to chase after high earning players (players that are often internationals) but without an increase in the number of international slots in the league (aside from the 8 new ones LAFC carries in). Perhaps, Atlanta is transitioning into a future state where a team cannot count on the market for international spots magically clearing every year at a relatively nominal cost. For instance, if Atlanta continued to roll into every season with 9 or 10 international players, perhaps teams would start to ransom them in a way that hurts, or perhaps the USSF presidency being up for grabs has spooked MLS into wondering if new constraints on international players are coming. Who knows. That all being said, Atlanta a) is good at converting internationals into domestics after a year of residency and b) if international spots are suddenly more valuable, why are Atlanta United trading all of theirs away? Watch this space I guess.
It has been reported but not confirmed that the $600K of incentives in the total transfer fee for Nagbe are the type of incentives that are hard to hit, meaning it’s very possible the fee is just the $1M. Incentives around Nagbe scoring a bunch of goals or assists when he’s going to be dropped back into midfield and doesn’t have a history of creating these anyways, are a stretch. And Nagbe winning league MVP or Atlanta United winning the league are the types of things that are both a) unlikely, and b) if they were to occur, I would suddenly not give a damn what the fee was.
I’m ready for Nagbe to be successful in Atlanta and I will 100% be rooting for this to be a successful move on ATLUTD’s part. I still have some concerns, but ultimately after reviewing all this stuff, I don’t think there’s so much downside in this to where there’s a huge negative tail risk. If it doesn’t work out and he doesn’t fit the system, the club have given up some of the initial expansion GAM and not much else. Tata can always revert back to a Larry/Carmona midfield partnership, and who knows if Nagbe were to leave in a year or two perhaps there’s a transfer fee coming Atlanta’s way. If it works out well and Atlanta continue to improve the squad with some of the rumored international players they’ve been linked to (or they bring back Yamil Asad), I could see a very high ceiling for the team.
Every so often Ted Knutson (@mixedknuts) who runs StatsBomb and StatsBomb Services will take public requests for analyticsy data viz type things his company normally only produces for clubs who employ them. I was lucky enough to have my wish for an Atlanta United xG histogram fulfilled, and I thought I’d post that here and talk about it for a minute. First, here’s what Ted posted on twitter:
Atlanta United xG shot distribution 2017, with Hector Villalba's shots highlighted. pic.twitter.com/V9701zHsuA
The way to read this is that every shot Atlanta United took in 2017 has been stacked into a bin based on the underlying quality of the chance according to StatsBomb’s xG model. Each unit (horizontal bar) represents a shot, and each dark unit represents a goal. Pink-shaded shots and goals are those of Tito Villalba who Ted has highlighted.
It’s curiously bi-modal, in that Atlanta took a ton of low quality chances, but also created a fair amount of chances in that 40-50% range (or more broadly, 30-60% range). I would love to see a histogram like this for the league as a whole to see what of this is unique to Atlanta and what is par for the course. But my instinct is to say that the league as a whole would look more like a normalish distribution around the average xG/shot of 10.5 (converted 10-11% of the time) and so this Atlanta look is interesting. ATL has a ton of shots taken that are worse chances than an average one, and a nice pile of above average chances as well with a crater in between. It’s interesting.
I looked closely at Ted’s graphic and decided to deconstruct it so to speak. Here’s the graphic with the actual conversion rates for Atlanta United (and Tito in pink) typed out and hovering above the histograms themselves. Compare these rates to the xG bins themselves to see where the Five Stripes over-performed and where they under-performed:
Atlanta finishes at or above average conversion rates in all bins except for that 0.15-0.20 xG bin where curiously they also have not taken a ton of shots. I wonder if these are traditionally where corner kick type chances land on this chart since the team’s trouble with corner kicks and/or preference for short corners was well documented. Atlanta’s overall xG per shot of 0.12 is slightly above average for the league and it’s conversion rate of 14% is definitely above average. For chances registered as more likely to score than to not (xG ratings above 0.5), Atlanta finished at a rate of 76%.
As for Tito, he performed above average on the lower quality end of the scale, which is an unsurprising result given what we saw this season with those laser beams from outside the box. He finished poorly across the broad spectrum of “good chances” though, taking 16 shots in the 0.15 to 0.5 xG range (where one might expect to finish 30%+ of the time) and only finishing 2 of them (for a pedestrian 12.5%). Tito did finish the exceedingly good chances well though, putting away all 4 of the chances that registered as more likely to be scored than not.
As discussed on this blog throughout the 2017 season, finishing is a tricky subject. And generally speaking high conversion rates and goal returns in excess of expected goals do not persist over long periods. Further, there are qualitative reasons we’ve discussed as to why Atlanta may have overperformed xG this year that do not relate to their ability to shoot better than others. I think breaking down the chances into views like this one are helpful, although it doesn’t necessarily crack the case for Atlanta in 2017. Seeing a league-wide histogram distribution might help to tell a better story.
I would say the team as a whole (and definitely Villalba) could work on passing up long range shots in favor of working the ball around the box to find an entry into the dangerous areas to create higher quality chances. Even though they scored at higher rates from those distances than historical figures would suggest, I’d say they might move from good to dominant or at least hold off a sophomore slump if they could improve in this area in 2018.
For reference, here are some other end of season finishing-related charts just to round out our previous discussions on the topic:
And lastly, ATLUTD’s place in history using AmericanSoccerAnalysis‘ data for goals minus expected goals. Definitely stands out, and this is without much love from set pieces (which TFC were excellent at) and penalties.
“It depends” is a frustrating answer to any question. I hate it. Even if it’s the answer that makes the most sense. In today’s post, which I hope will live on as an evergreen document, I’m not going to use that answer.
The question at hand: What is the best way to build an MLS squad using the myriad of complicated MLS roster rules: salary cap, designated players, GAM, TAM, Allocation Order, Loans, Superdraft, etc?
The answer: There are right ways and wrong ways to use each of the complicated MLS roster mechanics. Period. It does not depend. Welcome to the MLS Squad Construction 2018 User Manual. I advise you to put on a fresh pot of coffee, and perhaps, bookmark this page.
While I will touch on some of the major rules, generally speaking, this post is not an explainer of the MLS Roster rules (like you can find here). Instead, it provides pointers on how best to take advantage of each of the key roster requirements, rules, and mechanisms to create a superior squad structure. I should note that this analysis is based not as much in empirical method but in one of intuitive theory. I believe it is a sound underlying logic but please chime in by commenting on the post if you have questions or concerns.
Get ready for a long list of “Do”s and “Don’t”s for any MLS Front Office. Nashville SC, this one is free, the next one will cost you. LAFC, I still haven’t received that check you promised. Here is a table of contents for what is to follow:
MLS Squad Construction Manual
Introduction to Framework
Allocation Money as Increased Budget (not as tradable asset)
Designated Players and Young DP Savings
The Option Value of Loans and Subsidized Wages
Monetizing Allocation Order Ranking
Differences between GAM and TAM
International Slots & Investing in Scouting/Analytics
Limited value of SuperDraft picks
The real benefit of Homegrown Player Contracts
1. Introduction to Framework
Major League Soccer is a league of relative parity compared to other leagues around the world. This is by design as it is a single entity and the parity enforced via a complex set of roster construction rules orbiting mostly around a “salary cap” or “salary budget” depending on how technical you want to be. The broad strokes are that 20 senior players per team carry with them a “charge” that for most of them equals the wages they are paid by the league as a whole (single entity), no single player can have a charge higher than $480K (players who earn more than $480K are only allowed on a roster through the use of various other mechanisms like “Designated Players” and “Allocation money”), and the total “budget charges” on a team cannot exceed $3.8M (2017 amounts).
There’s a lot I want to discuss here, and I have given this a go before, but the core of what I’m going to talk about in this post is the general idea of maximizing a team’s talent given these roster constraints. As a general rule, I’m going to roll with the idea that wages (not transfer fees) are the better measure of a player’s competitive value on the field (outside of what his value as an asset might be in a cap or non cap environment). I first read about this in Soccernomics, but it’s a basically intuitive concept that on the whole, better players demand better wages, and so a team with higher wages generally has better players. I don’t want to get hung up on this point – we’re just going to need to accept it as a general fact – even though as I Google it, it appears some do take exception to the idea. And of course, teams make mistakes in signings. Regardless, it’s helpful to understand how to fit more wages into the constraints of the MLS Salary Budget given that most wages are funded centrally by the league and so with the exception of designated players, maximizing league-funded wages relative to a club’s competition does not come at an incremental cost to the individual club. And salary information is publicly available for MLS players.
Total Wages & League Parity
So I started by saying that there’s relative parity, and that all the teams have this “salary cap” thing of $3.8M, right? Yea, sort of. Here are the actual player wages paid by each MLS team in 2017 courtesy of Steve Fenn‘s excellent Tableau Viz:
These are the total team wages (players 1 – 29), not just the Senior players (1-20) whose charges must sum to the $3.8M budget cap. But the point should be clear, that while there is a salary budget/cap in place, teams pay vastly different total wage bills. Most of this variance is tied up in the optional signing of designated players whose wages can be as high as the individual owners are willing to fund them with the team taking only the league-funded $480K charge per DP against the $3.8M budget. What happens if we exclude DPs? While I’m working with a slightly different data source, here is a graph I put together of just the non-DP wages by team in 2017 (the league-funded wages):
This chart has the non-DP wages plus the DP and young DP roster charges (but not the DP wages in excess of the budget charges, which the individual club owners fund). The first black line approximates the nominal MLS Salary cap and the second line is a proxy for the cap plus an average year’s worth of distributed allocation money.
What you can see is that on a total dollar measure, the disparity between the teams is greatly reduced once you take away the excess wages supplied by individual owners directly for the designated players. On a low to high basis, we go from a range of $5M-$23M to $4M-$7M. There’s some timing noise in my numbers above, and I’ve done my best to add back the “league funded portion” of each team’s DP wages (200K for a young DP, 480K for any other). But an important reality is that once you take away all excess owner funding for designated players (a max of 3) and you’re just staring at the allocation of central league-funded wages (the salary budget), there’s still a not insignificant amount of room to maneuver if your goal is to maximize your team’s league funded wages relative to the rest of the league (as a proxy for maximizing your team’s talent relative to the rest of the league).
I should mention that while most of this article talks about the importance of maximizing league-funded wage bill, it is absolutely important to get your signings right also. All things considered, Orlando City popping up atop that graph above shouldn’t dissuade you from believing that more league-funded wages is better. They just signed some bad expensive players over their life (and to be fair, they only paid half of Dwyer’s wage this year and it’s counting his annual salary in the above).
2. Allocation Money as Increased Budget (not as a tradable asset)
The disparities in league funded team wages originate in several places, but the largest driver is Targeted Allocation Money (TAM). Each team received $500K in 2015, $800K in 2016, and $1.2M of TAM in 2017 (and there are reports of a fresh batch of $2M+ coming in 2018). This pool of league funds has several uses. Its primary use is that it allows teams to pay players that make more than the maximum budget charge and still comply with the roster rules without having to tag them as designated player (using TAM to pay down the wages of high earners to the max charge). As an example, this might allow a team to pay a total of $5.2M in non-DP wages even though the cap is $3.8M. TAM can also be applied to a transfer fee which otherwise would blow up a team’s budget number or require the player to be tagged as a designated player. And, it can be traded between teams. So already, we’ve got 1 way to use TAM that increases your team’s wages relative to other teams, and 2 ways that do not.
If you could choose between 1) signing a player for free who is worthy of a $700K wage by applying TAM to his wage and 2) paying a $500K transfer fee for a player worthy of a $200K wage and applying TAM to the transfer fee, it’s clear which one is the more efficient choice when building a squad in this rule-intensive environment. Find the players who are out of contract that can help your squad (seems obvious) and you’ll be able to pay higher wages than if you’d spent TAM to pay a transfer fee. And all else equal, the third option is even worse: trading your TAM to another MLS team for another MLS player’s contract (think of it like an intra-MLS transfer fee). Instead of spending your TAM money to purchase a player like in #2, you do that PLUS you give another MLS team more TAM –TAM that they can use to increase the wages of their roster relative to yours! Transactions like these are veritable “six-pointers.” If you trade someone $200K of TAM, they now have exactly $400K of potential wage budget more than you had before the transactions. If the primary framework of this post is to max out league-funded wages to build a stronger roster than your opponents, trading allocation money is bad.
Orlando City Examples (Good and Bad)
As an example of what a team should do, Orlando City traded Kevin Molino (2017 guaranteed comp of $400K) to Minnesota United for $650K of allocation money. If Orlando City thought they could find a suitable replacement player on the international market demanding somewhere around $650K of transfer fee and $400K in wages, this move makes sense as they’d be extracting team wages from Minnesota, on net. Alternatively, if there was an international player out of contract somewhere that fit their needs, they’d potentially have $1M of cap room to play with to find a replacement TAM player (a real potential upgrade over Molino).
As an example of what not to do, instead of using the allocation money they’d just received from Minnesota, halfway through the season Orlando City traded $1.6M of allocation money to acquire Dom Dwyer’s contract (2017 guaranteed comp of $670K) from SKC. Dwyer’s current contract requires its team to feed it a minimum of $180K of TAM in addition to the max budget charge of $480K. By making this trade Orlando has lowered its team’s league-funded wage bill relative to its peers while still taking on a big contract that requires continuous league assets to stay compliant. On top of this, it sounds like Dwyer’s contract is nearing its end and his next one will need to be DP level for him to re-sign, so it’s possible Orlando’s best case scenario and worst case scenarios for Dwyer are both difficult to swallow. Worst case (i think), he leaves when his contract is up, and the team effectively paid $1.6M for a season and a half of no playoffs. Best case, he signs and becomes a DP, and now he’s taking up one of those precious DP spots for $480K max cap charge.
Rule: “Use” TAM to reduce a player’s cap hit to your team’s salary budget, don’t trade it to other teams. At least not for another MLS player contract.
Sub-rule: If a team offers you TAM for a player that you can find a replacement for from outside MLS for similar money, go for it. You’re lowering their total potential league-funded wage bill. You will either use the received TAM to replace the player via transfer fee, or if you can find a similar player on a free, you can apply that TAM to those wages or increase your wage bill elsewhere while decreasing your competition’s overall roster strength.
Sub-rule: These same principles should work for General Allocation Money (GAM) as well. GAM is like TAM but it has even greater utility in its flexibility.
3. Designated Players and Young DP Savings
Recall the chart above that showed most team wage inequality comes from designated players. This is obvious, but it is critical that a team “hit” on their 3 designated player signings. There are two different lenses we’ll view this from. First, the fan lens, where we can assume that our team’s owner has virtually infinite resources and does not consider transfer fees for designated players to be an investment. This is a simple thought exercise: simply sign the best players that are available and that you can convince to play at your club: most likely attacking players as goals and assists are hard to find. But there are simple ways to maximize your overall league-funded wages with designated players also: namely signing young designated players (aged 23 and younger) who only count $200K against the cap instead of the standard $480K. If you were to sign 3 stud young DPs instead of 3 DPs in their prime, you would have $840K of additional cap room to spend on strengthening the rest of your squad. This is a significant chunk of change: Tito Villalba, Victor Vazquez and Sascha Klestjan make around $650K each. However, I have to mention that if this is strictly the fan perspective first, you may not want to spend all 3 of your DP slots on young (potentially risky) players when you could buy 3 David Villas instead that are proven.
However, from an owner’s perspective — specifically an owner who cares both about having a winning team AND about internally financially prudent things like ROI — the 3 designated player slots should be thought of as investments to the extent that the players signed command significant transfer fees. If this is the case, the Young DP route is absolutely the way to go. First, we already mentioned the competitive advantage to the rest of the team’s budget structure ($200K vs $480K cap hits for each DP). Secondly, if you care about ROI, then any one-time transfer fee paid to another club around the world should be thought of as a prepaid asset and not as an expense. Simply put, you should be paying a transfer fee that you believe you can recoup when the player departs the club. And really, the only way to do that is to sign a young player whose value is still on the rise. The goal doesn’t even need to be to receive more than you paid, simply to recoup. You can’t do that with an established player but you can with a young player. The cap room you save by signing young DPs will allow you to strengthen elsewhere with veterans.
Good examples of this are FC Dallas (who filled all 3 2017 DP slots with young DPs, successfully generating that extra $840K budget amount) and Atlanta United whose Almiron and Villalba counted as young DPs (a combined $400K against the cap instead of $960K), allowing them to spend $325K on an expensive veteran CB like Michael Parkhurst to captain the expansion side. Below is a breakdown of the 2017 DP wages.
Someone will probably call out Montreal. For whatever reason Piatti still shows up in the Players Union Salary releases as making $450K (under the DP threshold). I don’t think this is true, but the data is the data.
Rule: Sign young DPs instead of old ones to a) gain an $840K budget advantage with which to strengthen the rest of your squad and b) to increase the chance of eventually recouping transfer fees paid to sign your DPs, and c) increase the chance of turning a profit on the player’s departure, which could add up to $650K of GAM to your team’s overall budget (or more, if they change the rule).
4. The option value of loans and subsidized wages
If we maintain our goal of increasing the squad’s wage bill relative to the competition, there’s another tool to add to the kit. It is customary in global football for clubs to loan young players to one another for half seasons or seasons at a time. Acquiring players on loan is helpful in MLS for a few reasons. The first is that it is not uncommon for a home club to pay a portion of the loanee’s wages. Having a player on your roster in MLS but not having to pay 100% of that players wages is immense as it allows you to once again strengthen the total wage bill of your club (and it’s overall roster strength) relative to the rest of the league. Secondly, loan agreements often have purchase options and options are always good. Specifically in MLS, the ability to not bring a player back next season if he’s not working out this season allows you to free up the cap space needed in the following season to find the player’s replacement. In MLS with strict salary cap rules, a bad player on an expensive contract that you can’t get rid of can cripple your team’s overall budget strategy in a way that doesn’t exist in other league’s around the world.
In 2017, Atlanta United acquired 4 players on loan: Josef Martinez, Yamil Asad, Greg Garza, and Anton Walkes. Martinez was a DP whose option was exercised after just 3 games because it turns out he’s Thierry Henry but good. Asad and Garza were paid $150K each by Atlanta, suggesting to many of us that their home clubs footed the bill for the rest. And Anton Walkes was a league minimum $53K charge for Atlanta, suggesting Tottenham paid some portion in addition to this. Atlanta was able to allocate these additional funds to strengthen the squad in other ways. But more importantly, nothing is ever a sure thing. It’s possible all 4 of these guys might’ve been failures and had the deals not been set up as loans, ATL could’ve been heading into 2018 with no roster flexibility (like Orlando City). The roaring success of all 4 players in 2017 has left Atlanta with much better problems to have (which I’ve discussed in other posts).
Rule: Roll the dice with 3 or 4 high upside loanees with purchase options while if possible having their home clubs subsidize the wages. If 2 are winners, exercise their options and call it a day. The rest go back to their clubs next year and you have cap space to play with. Use wage subsidies on loanees to strengthen other areas of the team, increasing your effective team wages relative to the rest of the league.
5. Monetizing Allocation Order Ranking
OK, this one is just weird. Basically there’s a ranking/priority order for MLS teams chasing USMNT players or other good players that used to play in MLS but who’ve left and want to return to the league. Basically if you want to bring one of these players into the league, everyone in front of you in the ranking order has dibs before you can sign the player. This order resets each season in a worst to first ordering (giving bad teams the first crack at utilizing this mechanism in the offseason) with expansion teams automatically getting the first pick. So a couple features to this thing that are really important. First, it appears to me that the only spot in this ranking that has value is the #1 pick as the #1 pick has right of first refusal whenever there’s a player trying to reenter the league. Second, as the summer transfer window closes (halfway through the MLS season), the market value should start to disappear because if the team in the #1 spot doesn’t use the mechanism it doesn’t get to hold onto it: the order will reset the following year and they’ll likely lose that spot. Third, the timing of when players decide they want to come back to MLS and whether these players meet the needs of MLS teams matters and is somewhat random. Fourth, just from looking at recent transactions and the valuations inherent in them, this thing matters, and clubs place significant value on it. Here are the 2017 allocation order uses and trades:
Chicago trades GAM (undisclosed) + 1st round pick + 3rd spot for Minnesota’s #2 spot (Juninho)
Atlanta signs Brad Guzan (free transfer)
VAN trades $225K + International Slot to Minnesota’s #1 Spot (Freddy Montero loan)
DC trades $175K + 9th spot in the order for Dynamo’s #1 spot. (Deshorn Brown)
NE trades $175K + 5th spot in the order for San Jose’s #2 spot.
NE trades $400K + 2 years of intl slots to CLB for rights to Kriztan Nemeth through CLB’s #1 spot in the order
Just eyeballing it, that looks like basically if a decent player is on the line, we’re talking about the #1 ranking having a trade value somewhere in the range of $300K – $600K in allocation money. Additionally, similar to the principles we discussed earlier around TAM, the type of player you bring in through this mechanism is either a high value TAM player or a DP — my point being if you trade for the #1 pick, you’re trading a bunch of allocation money and then needing to use more allocation money to pay the wages of the player you’ve acquired. While I don’t know for sure, I can’t imagine any team would trade league assets to another league team in order for the rights to then pay a hefty transfer fee to a foreign club for the rights to pay a hefty wage to the incoming player. But, I’m sure this has happened. What’s probably much more common is that teams monitor the allocation list for players whose contracts are expiring. As an example, Atlanta United were able to use their #1 ranking in the allocation order to sign Brad Guzan on a free transfer (i suspect he’s on $700K wages or around there).
The question though is, what’s the best thing a team can do with a high allocation order ranking (what’s our next “Rule”)? It appears to me that if you’re going to exercise your privilege from the top spot of the allocation order, you have to strike it big and you have to find a player who is out of contract (Brad Guzan is a good example). But there are generally, more efficient plays: namely, trade the allocation ranking down to another team who has their hopes set on an available player. Collect allocation money and other assets from that team, thereby necessarily increasing your team’s potential wage bill relative to your competition’s (all at zero actual additional cost). Because the #1 ranking is the only one with real value at any given moment, an ideal string of transactions would be finding yourself at the #1 spot multiple times in a given season, by trading the #1 spot down for the #3 spot let’s say + allocation money. Then after one more team uses their position, you’re back in #1 and ready to fleece the next team for allocation money should a big name be available. All the while, you would have to keep an eye on the clock and realize that your allocation order will not carry over to next season.
So, while Atlanta’s Brad Guzan signing was certainly a success, what Minnesota did was also very interesting and in my mind, clever. They started the season in the #2 spot, but on Dec 23 traded the #2 spot to Chicago for the #3 spot + allocation money (undisclosed) + a 1st round draft pick . Then After Chicago took Juninho and Atlanta took Guzan, Minnesota had the #1 spot and traded it to Vancouver for $225K + a 2017 international slot. So the basic concept is there, so long as you hold teams near the top of the order hostage for the highest possible ranking spots, you can put the league through the windmill so to speak, repeatedly landing yourself back atop the order and demanding more assets to let other teams go after their guys, all the while increasing your league-funded team wages relative to your competition by buying TAM not selling it. There’s some nuanced game theory in there somewhere, but at least as a framework this should be the goal. LAFC, read this paragraph again.
Rule #4: Trade allocation ranking order down a few spots to collect allocation money, then do it again once your team is back up in the top spot. Remember not to let the summer transfer window close on you in the top spot.
6. Differences between GAM and TAM
In principle, general allocation money and targeted allocation money do the same thing: they allow a team to have a wage bill that exceeds the nominal $3.8M salary budget cap. But there are key differences that should have an impact on front office behavior. First of all, targeted allocation money can be applied only to players who make more than the $480K max budget charge but less than $1M. And importantly, GAM and TAM cannot be combined and applied to a single player’s budget charge. Because of this, if a team is trying to sign a player right around that max budget charge and also comply with the league’s $3.8M budget cap, whether his wages are ultimately above or below the max charge may depend on which allocation money resource is more plentiful for the club. You may want to pay a player $500K instead of $475K if you have enough TAM (but not enough GAM) to reduce his wage low enough to slide under the overall budget cap. In order to increase your club’s league-funded wage efficiency relative to your competition, it may involve paying a player more than his market value, as counter intuitive as that may sound. Sam Steejskal first reported on these sorts of odd incentives.
Secondly, understand that while General Allocation Money is indefinite-lived, Targeted Allocation Money does in fact expire after 4 transfer windows. As an example, TAM issued in 2017 will expire at the end of the 2018 season. This presents interesting and complex scenarios. Take for example a situation where Team A may have TAM that’s about to expire. The value of this expiring TAM is quite low to most teams, but perhaps there’s a team out there (Team B) that is trying to pay a one-time transfer fee before the window shuts to secure a player. Assume also there are other teams with varying common needs of TAM and stocks of TAM. Team A’s goal should be to identify the appropriate trading partner (Team B) who has a need for TAM for the purpose of using it in the very short term (before it expires). Offers from other teams in the league will surely be low-ball in nature because the TAM is about to expire. Team B’s goal should be to find a cut rate deal for TAM given the presence of TAM that is about to expire. If Team B deals with any other team than Team A they’ll likely have to pay more for the same amount of TAM (different vintages). Something to think about. Less of a direct takeaway.
7. International Spots
I’ve mentioned over and over again that when teams are considering trading for a player currently under contract with another MLS team, that they should evaluate whether there are comparable players available on the global market because it makes sense to use TAM towards a fee outbound from MLS rather than trade another MLS team an asset that increases their wages relative to your own for a similar player. In order for this process to work, you need International Spots/slots. Each team starts with 8 but these are freely traded in 1 or 2 season increments. Based on my research, the market value seems to be between $50K and $75K of allocation money, but they’re also acquired by trading other assets like draft picks or players. I’ve also noticed that this market normally clears. Some teams like to have a lot of IS slots and others only use a handful, so teams don’t seem to have trouble acquiring the international slots they need, and I’m yet to see a team really be held over the barrel for one.
Most importantly though, if you can get your international players Green cards after they’ve been around for a year, then you no longer have to use an IS on them. This is a free lunch, and every team should pursue it. As IS spots free up, you can either monetize them or use them to sign players on the much more liquid global player market (compared to the unionized and single entity-contracted MLS player pool)
Example: Atlanta getting Green Cards for Kenwyne Jones, Chris McCann, and Kevin Kratz. Not only does it free up IS spots, but it theoretically increases the intra-MLS trade value of these players slightly.
Rule: Acquire international spots in order to ensure the ability to compare MLS trade opportunities to global player market. Work international players through the US Customs Office Green Card process to free up international spots and increase player trade value.
This is a good time to mention that I fully realize that the directive to sign comparable internationals instead of trade for MLS players in an effort to maximize your league-funded wages relative to your peers comes at a real cost (not a TAM/GAM asset cost). This is because while trading assets for MLS players is not an efficient use of league assets and cedes inherent competitive advantage, it costs less “real life dollars” to gather information on MLS players than it does to hire scouts and analysts to generate information on players abroad. The costs of setting up a quality scouting and analytics department do not count against the salary cap. They are simply real costs to be incurred by the owner of a club. So one way to think about this is a tradeoff between the following two models:
Spend more money on scouting and analytics. In doing so, spend allocation money on wages and transfer fees for international players that you otherwise would trade to an MLS team for a comparable league player. In doing so, you increase your team’s league-funded wages relative to your peers, increasing your theoretical advantage.
Spend less money on scouting and analytics. Instead, give up league assets to other MLS teams in order to acquire league players (the cost of this information is not the real life dollars you would spend on scouting/analytics but instead the ceding of competitive advantage to other MLS clubs).
One of these seems like MLS 3.0, the other MLS 2.0, at best.
8. The limited value of a SuperDraft pick.
I’ve placed a high value on allocation money in all of the above rules/arguments, so I should mention an asset that should be given a much lower priority: SuperDraft picks. Each year players are drafted out of college via the 4 rounds of the MLS SuperDraft. Before the draft there’s a combine where players work out and scrimmage in front of all the teams. Generally speaking, players drafted in the SuperDraft either make the senior minimum wage or the reserve minimum wage, or if higher than that, they are tagged as Generation Adidas players (normally the top prospects) and they are automatically eligible to be placed on the supplemental roster (and therefore not count against the cap). Kevin Minkus at AmericanSoccerAnalysis did a study to understand the value of SuperDraft picks based on their ordering. I’ve included his chart below:
Kevin Minkus at AmericanSoccerAnalysis pulled together this helpful chart looking at empirical success rates as measured by minutes contribution across the 4 rounds of the draft.
Basically each pick in the first round is expected to contribute fewer and fewer minutes over the first 2 years a player is in the league, with anything outside of the first round being mostly valueless on average. When you consider that a healthy MLS academy is pumping out homegrown players who are competing for the same roster spots, there’s a very real argument that an MLS team should not want to make any pick outside of the first round (anomalous draft classes not withstanding). This makes me thinking that whenever a team needs to trade for a player or an asset, they should first start by offering SuperDraft picks. If you need an international slot, try a SuperDraft pick, what about a nominal amount of GAM or TAM, try a SuperDraft pick. Want to move up a few places in the allocation order? (say from 7 to 5 and then hope 4 teams utilize their rankings allowing you to spend some amount of time in the top spot) Try trading a SuperDraft pick or two.
Something you should not do is trade allocation money for a better SuperDraft pick. I simply do not understand it. As an example New York City FC traded $250K of GAM to Chicago for the rights to draft Jonathan Lewis, who is certainly a prospect with some upside. But I don’t follow why drafting Lewis and hoping he develops into a good player who if he becomes a good player will demand a higher salary is better than spending $250K of GAM (effectively $250K of salary budget) on a player of the $250K caliber. Players who make around $250K include Leandro Gonzalez Pirez, AJ DelaGarza, Steven Beitashour, Drew Moor, Sebastian Lletget. Point is that’s the caliber of player you can have on your team at that wage amount – now acquiring one of those players may cost something, or it may not. Older players like Jeff Larentowicz ($175K) was a free agent around this time.
In contrast, Atlanta United have done a decent job trading SuperDraft picks for assets, including: 2017 #24 pick for 2 seasons worth of international slot, 2020 4th rounder for Kevin Kratz, 2019 fourth rounder for Harrison Heath, 3rd rounder or conditional 2nd for Romario Williams, 2018 2nd rounder for the discovery rights to Greg Garza.
They did trade an expansion drafted player for the #8 pick and turned that into Julian Gressel, which has worked out swimmingly, but I don’t think this sort of move works out very often.
Rule: Trade your Superdraft picks away for assets you can use to increase your team’s total potential league-funded wages relative to your competition.
9. Homegrown Players
The league (and surely in partnership with USSF) has created special rules around homegrown players that are supposed to create incentives for clubs to invest in youth development. I want to clarify specifically what the incentives accomplish here, because I think there’s some confusion about the way people talk about this. First the rule: basically, if a player qualifies as a homegrown (he’s played in your development system for a year), he isn’t subject to the Superdraft and instead you can sign him to your team as a homegrown player. He will occupy a supplemental or reserve spot on your roster so he won’t count against the cap, so long as he makes $125K or less (they start out making much less: Tyler Adams makes $75K).
So I want to be clear, that the primary benefit of the homegrown player designation is *not* that a homegrown player doesn’t count against your cap. After all, no supplemental or reserve roster spot (21-29) counts against the cap (basically the low earners in MLS). If we play the scenario out where a club successfully develops a star out of their youth system, while he’s still developing in his early years in MLS he’ll be on the supplemental/reserve roster, making $75K or so and not counting against the cap. But if the player truly becomes a star, at some point it will be time to renegotiate a contract and his wage demands will exceed $125K (perhaps at this point there are clubs overseas offering him much more than this). It is at this point that an MLS club can either a) sign him to a fair market value wage, at which point he (like all other good players) counts against the cap and the homegrown player tag goes away, or b) sell him overseas and take the profits from the sale (which is basically the entire fee) after MLS takes its cut (or doesn’t if they change the rules as reported), and convert $650K of this profit into general allocation money to increase the strength of the squad. If you’re still reading at this point, I think you know where I’m going with this. The primary purpose of the homegrown player rule, is not for MLS teams to create homegrown superstars and keep them in MLS (if it was, then the rules would be much more generous to teams who do this – maybe the player’s wages would be exempt from the cap hit regardless of amount). The rule is designed to create an incentive for MLS teams to develop youth players in the area into stars and then sell them overseas. One important note, which I may explore further in another post, is that in order to sell a player oversees for a significant transfer fee you need to resign the player to a long term contract. So the act of turning a non-cap hitting homegrown into a transfer fee may involve a transition period, where the player is briefly making something closer to a fair market value wage before a foreign club comes in for him.
Rule: Develop homegrown players by stashing them in spots 21-29 on your bench and getting them minutes, and then when they have developed into stars, sell them to generate profits which you can convert into general allocation money to further strengthen your team (increase your team’s league-funded wage bill relative to your competition).
Alternatively, you can sign a homegrown player out of college who would otherwise have entered the SuperDraft if he has fulfilled the 1 year of development within your academy. This 22-23 year old is likely more ready to see significant minutes in MLS than a 16 year old phenom prospect. Accordingly, there’s a benefit to paying the 22-23 year old an entry-level homegrown wage and have him not count against the cap.
That’s it for now in terms of the “Do”s and “Don’t”s.
I should mention Jared Young at AmericanSoccerAnalysis has a similar full breakdown of Roster Construction here. He comes to some different conclusions about what portions of the roster a club should focus on. It’s an interesting read and a very helpful breakdown of the key rules.
Let me know if you have questions or ideas on where to take this from here. I’ll likely be publishing something like this in chapter form over at DirtySouthSoccer. I’d also like to looks specifically at some of the nuances of how an expansion team can find advantages – with the expansion draft and other types of things.
I also have vague plans to publish some MLS Trade Price Guides as the league becomes more and more transparent with the amounts being traded around.
The return of match previews / opposition analyses, whatever you want to call them. Hello wordpress. It has been a while.
Atlanta United (#4) plays Columbus Crew (#5) at 7pm Thursday October 26, 2017 with #Narrative abounding. Quickly just to set the narrative table, before we get into the useful stuff:
Columbus Crew are probably getting moved to Austin, TX after the 2018 season
ATL were inches away (multiple times) vs TFC from earning a first round bye
Atlanta United fans boo’d the most recognizable US National Team players vs TFC
Both teams played Sunday afternoon/evening after a week of rest.
I am going to preview this matchup / prepare a stats-based opposition analysis.
First, to relive the home match at Bobby Dodd Stadium earlier this season, check out my old post here. If I’m honest, the content was better then. That was a fun match.
Goal Keepers (we’re going to go back to front, sorta):
Atlanta United have one of the best goal keepers in the league. Possibly the best. AmericanSoccerAnalysis has a model for measuring the average number of goals a keeper will concede on average for a given profile of shots on target he faces. If you compare the goals Guzan has conceded to his expected goals based on this method, he leads all keepers but one in MLS with -0.28 per game. Only Tim Melia’s -0.36 per game tops it. Crew SC’s Zack Steffen, on the other hand, is 18th out of 22 starters in the league by this metric, conceding 0.13 more goals per game than the model would suggest. See below for a visual. Red dots are playoff teams.
In terms of distribution, Guzan leads the league in pass completion rate, largely because he plays the highest percentage of short passes in MLS. Steffen is 7th in MLS and not so far off substantively. Columbus likes to play it short out of the back as well. See below:
Style of Play
One metric to use for style of play comparisons is Cross to ThroughBall ratio. If I look on whoscored I can get this for key passes only (couldn’t find throughballs that don’t result in shots – probably because they are rare). Columbus looks similar to Atlanta in this regard:
Another metric we can look at is the portion of a team’s total passes that are long passes. Columbus plays the second fewest long balls in MLS (behind NYC). They are technically proficient and like to play the short passing game.
When Columbus visited Atlanta earlier in the season, they upped the percentage of long balls to 18% (16% in the first half). Even at home in Columbus, they passed long slightly more often – likely to combat Atlanta’s high pressure and bypass the midfield (to minimize turnovers). Here were the pressing/tidiness stats from those matches.
Across the two games, Atlanta turned Columbus over in its own half 6 times per own-half pass on average, which is a slightly less furious pace than Atlanta’s home average of pressing its opposition into errors every 4-5 passes. On top of this, the Five Stripes are disrupting opponents’ own-half buildup at a lighter pace in Mercedes Benz stadium, whether due to fitness conservation or the size of the pitch, or another reason. This all adds up to make me wonder if we are going to see the same sort of high pressure success on Thursday. This worries me as an ATLUTD supporter because I know the team is comfortable simply releasing the hounds of pressure.
Centre Back Distribution
Since we’ve established both teams like to play from the back, let’s see how the centre backs stack up in terms of distribution. Below is a graphic of pass completion % on the Y and Long Ball % on the X, with Crew SC’s starting defenders colored yellow and Atlanta’s red:
Both teams appear to be above average passers based on this simple metric, and surprisingly, Atlanta’s CB’s actually play long balls slightly more often than the average centre back with over 15 appearances this year. If I had to pick a Crew CB to focus on turning over it would be Mensah, just slightly. ASA has a handy tool that’s more sophisticated than what I graphed above to measure passing skill, which they call xPassing.
According to this metric, all 4 starting CBs pass at a more successful rate than one would expected for the types of passes they attempt. Columbus’ duo shows up slightly better here. For anyone worried about Parkhurst not being fit for Thursday, these metrics show Larentowicz as slightly worse than LGP on this metric (but still positive), and Walkes as a worse distributor (-5.3%).
Atlanta created a goal in the first match when Asad stole the ball from the back line and found Villalba in the danger zone for an easy-looking put-away. But based on the above data, I wouldn’t label this as a particular opportunity for Atlanta to exploit. Columbus is pretty good at keeping the ball and playing it on the floor from back to front.
In the first match (BDS) Columbus did not press exceedingly high as Atlanta advanced, waiting until the ball reached the top of the center circle to engage. And this worked generally well for them in the first half, creating a few good transition chances from picking off passes from the ATL centre backs at midfield. If Boswell or Walkes play in place of Parkhurst, expect this to change (with a more aggressive pressing approach), but in general, I think this is a fine strategy for an away side at Mercedes Benz Stadium. Below is a poorly drawn formations graphic showing expected lines of engagement for pressing. These will change as the game state changes, but I expect Columbus to press in that middle third more often to spring transition, while Atlanta hunts the ball no matter where it is (all the way to the Columbus back line). This isn’t to say that Columbus won’t press all the way back to the keeper when Atlanta are in a vulnerable moment (facing their own goal in defense etc).
Expect Columbus to invite Atlanta’s press and then try to bypass midfield in transition with one touch passing or balls over the top.
Shapes
I haven’t watched much Crew lately which is why this post is mainly stats-type analysis. But I’ll trust Matt Doyle that the Crew have stabilized into a 4-2-3-1 with Kamara leading the line and Higuain, Meram and Santos forming the band of 3. Trapp and Abu in the middle with Afful/ Mensah/ Williams/ Raitala in a back 4.
While Martino has played with various formations in the runup to this game (4-4-2s against New England and Red Bulls, and 3-4-3 vs Toronto), I expect him to return to a traditional back 4 (with 2 CB’s marking kamara) and the deepest midfielder dropping back between the CBs while ATL have the ball. A 3 man back line isn’t optimal against a lone striker.
Creative Influence
You can probably guess who leads chance creation numbers as measured by expected goals + expected assists per 90. Kamara, Higuain, and Meram are contributing 0.66, 0.49, and 0.47 xG+xA per 90, respectively, with Kamara’s output primarily accounted for with an expected goal every 2 games, and Higuain’s and Meram’s outputs split more evenly between expected goals and expected assists. There’s no doubting that this is a dangerous front 3. And honestly, the answer to how to defend against these guys does not lie in the simple kind of analytics I’m capable of. But there are other things of course.
Interestingly, if we look at xBuildup (a metric published by ASA, helpful for assigning credit to players for their role in the buildup or creation of a chances that does not include the player taking the final shot or shot assist), an interesting name pops up: Mohammed Abu, registering 0.4 XG per 90 -> suggesting he has a hand in some form of the possession sequences leading up to (but not including shots or shot assists) about 0.4 expected goals created per game. Not bad since the Columbus are creating 1.4 xG per game on average. It would appear as though Tata Martino should be focusing some tactics to disrupt Abu in possession. This might mean placing an athletic/motor player centrall in the #10 spot to harrass and deny Abu time and the ball. Break the link most commonly chaining possessions into scoring chances and you will have accomplished something important.
Attacking and Defensive Trends
If we look at expected goals for and against trends for Atlanta home matches and Columbus away matches, it’s a little uncomfortable for my liking. Both teams hit an electric attacking run of form in September and have cooled off some, and both club’s defensive averages have inched up in October.
Atlanta’s latest 3 game home form on the attack side is 1.6 xG, which Columbus has matched away from home. And Atlanta’s home form on the defensive side is most recently a 3 game average of 1.3 xG conceded, with Columbus holding their opponents to 1.2 xG on the road. There are always #reasons. The Minnesota game is weighs heavy on the Atlanta averages given the red card to Reynish and the injuries to Almiron and Garza and callups of Martinez and Guzan. And also, as I’ve discussed previously on the blog, big chances that Atlanta creates on the break are often not captured well by the expected goals model. The overall defensive trend before these last couple of games was very, very solid for the Five Stripes.
Other Concerns
Kevin Minkus yesterday pointed out that Atlanta United are giving up high quality shots off of set pieces and Columbus may in fact create good shots off of set pieces, even if it has been relatively few to date:
Oh and Columbus generated the second highest xG/shot of any playoff team, though it came on the fewest shots from set pieces in the league
This is scary. Lots to think about. I have this general fear of going down a goal early and then chasing the game against an awful game state (DCU type stuff), and so I’m hesitant to suggest really pushing numbers forward early to strangle the visitors — the thing is, this is exactly what the other part of my brain is screaming. Columbus will be travelling on short rest, with non soccer baggage lingering, and so it’s tempting to suggest a full on raiding party in the opening 10 minutes – kill them off early.
The thing is, the underlying numbers (to me at least) suggest a slowing of the high press at MBS. Maybe I’m not capturing what’s really going on, but I can think of reasons why the press works to less effect at MBS than BDS. And I also recognize that Atlanta have the home crowd advantage for this entire match, whether it be 90 minutes or 120 minute or all the way to PKs (shudders). I’d hate to spoil that by playing 75 minutes down a goal against a bunkering Crew who nicked a counter goal early. So I think my overall recommendation would be to exercise caution early on (I know you’re probably shaking your head), save some legs for what might be 120 minutes. The other recommendation is to task someone in the central attacking channel to press Mohammed Abu relentlessly, even at the expense of showing for the ball in transition. I’m not sure if this should be Almiron or Asad or even Gressel(!) who could be in for a starting role if Parkhurst isn’t ready (and Jeff slides back). And I hate to over think it, but something tells me we won’t succeed with Tito’s pace out wide in this one like we have in recent matches. We didn’t create much from wide in the first Columbus match (admittedly the field was narrower), and our goals came over the top in the second. I think I am calling for an inverted Tito on the left, a centrally located Asad, and Almiron inverted on the right. With players rotating to conserve energy and sanity as the central most player bothers Abu all night.
God speed. Hopefully, I get to do this again before next year.
Josh over at Dirty South Soccer wrote a really nice piece on some of the observable differences between Atlanta United playing at Bobby Dodd and Mercedes Benz. Click here to check that out. I’m not as eloquent or as wise as him, nor as versed in soccer tactics, but I wanted to just drop some data / graphs in here that I’d been tweeting about in recent weeks to add to this comparison.
First up, here’s a table I keep to track some of the Atlanta United tidiness stats.
Takeaway1: Atlanta are tidier on the ball at home, and more tidy on the ball at the Benz compared to Bobby Dodd. This shows up in the own-half passes per giveaways and own-half passing % metrics.
Takeaway2: Atlanta are suppressing opponents’ shots (and shots on target) at home, and most impressively at the Benz. The result is improved expected goals against figures as well as improved goals conceded figures.
Next up, the pressing stats for Bobby Dodd, Mercedes Benz, and away matches:
Takeaway1: Interestingly, while Atlanta United pressed more furiously and to greater effect at Bobby Dodd than on the road, the pressing numbers come down quite a bit at MBS – could be schedule congestion and fitness conservation – could be larger pitch makes it harder to press opponents into mistakes.
Takeaway 2: ATL Goals and Expected goals have trended up furiously at MBS compared to Bobby Dodd, both being higher than the average away matches output. Expected goal data comes from AmericanSoccerAnalysis.com as always.
Game by Game Pressing/Tidiness Game Stats (I hadn’t posted these here since the FCD match.
ATL-NE stats aren't super meaningful, but for grins, here's the pressure/tidiness table for that "contest" pic.twitter.com/nx2md55wgc
Atlanta v Orlando City III – Own-half Pressure & Tidiness Stats. Orlando bypassing their own half often. 28% of passes long vs ATL's 16%. pic.twitter.com/j1u8qlZQtI
Also, a bit late, but i found the pressing stats in the first half vs LA interesting. ATL not turning LA over high up as much. 2H = bad data pic.twitter.com/wLjdFYukne
What a well drawn up gameplan looks like when executed well in the first half. Sparkling from the go and comfortable at halftime for #atlutdpic.twitter.com/TErN2pVTz5
Pressure Stats from #NERevs#ATLUTD . Bit of a role reversal this time as Tata supposedly set out to rest the team and play behind the ball pic.twitter.com/iVNqzDX89y
Pressure stats from last nite's #atlutd#MNUFC . Pretty incredible performance by ATL down a man and understaffed in the 2nd. Kept pressing pic.twitter.com/xA23yRxPPp
I wrote a piece for DirtySouthSoccer, which you can find here, where I update us all on the PACE standings as of Monday 9-25-17. Then I ponder some difficult questions around whether one can rotate the squad when there’s still so much left to play for. #4 comes with homefield advantage in the play-in round, #2 comes with a first round bye. Atlanta are favored to achieve both of these, but the Almiron injury…
Home field advantage is a real thing in sports. And it impacts soccer more than any other major sport. Freakonomics argues that home field advantage is primarily driven by refereeing decisions as the raucous crowds have a conscious or subconscious impact on the referee when he goes to make difficult decisions. In soccer where the referee has greater latitude to make highly judgmental decisions that significantly impact the game, homefield advantage is felt the heaviest:
More interestingly, homefield advantage is greater in MLS than in the 5 major European leagues. In the major European leagues, home sides generally average 1.6+ ppg, but in MLS it is 1.8 ppg at home. This is a significant difference. Some have argued that the difficult travel times (unique to the larger US geography) and coach class commercial flights have a big impact here, but personally, I think it’s more likely that a similar homefield advantage exists in America as it does overseas (i.e. one that is primarily determined by important, judgmental referee decisions per Freakonomics), but that the parity of the league amplifies this effect. After all, if there is a very little difference between two teams facing one another on the field, any inherent advantage to the home side will show through more often. And this happens in MLS. And of course, MLS by design is a league of great parity relative to the European leagues. There’s a Salary Cap and some other interesting roster budget mechanisms that I’ve discussed before, severaltimes. A league designed to be competitively even (like some other popular US-based professional leagues) should suffer more from the impact of unconsciously biased referee decisions. Perhaps this is why they are adopting V.A.R. ahead of the rest of the world. A post for another day.
But, here’s what I wanted to talk about: the Playoffs.
This week Sam Stejskal at FourFourTwo reported that MLS is considering an overhaul to the playoffs formatting due to scheduling issues where the FIFA international break slows down the “momentum” of the playoffs between the conference semi-final and final rounds. Currently those rounds are home and home double-legged affairs with away goals being the tiebreaker if aggregate scorelines are tied after 180 minutes plus stoppage. The reported proposal would swap out these double leg series for single elimination games hosted by the higher seeds. Stejskal mentions that the lower seeded team has won 8 of the 12 conference championship series since the current structure was introduced (this seems like a perfectly reasonable outcome over a sample as small as this if you buy that home and homes are mostly fair to both teams). Also posted at FourFourTwo acutally… while I was drafting this paragraph, is this piece by Steve Davis, who mentions that 11 out of 12 single elimination play-in games have gone to the home sides!
It is my opinion that switching to fully single elimination games hosted by the higher seeds would be a mistake because of the significant home field advantage in MLS, which is due to the significant level of parity in MLS (something the league purposefully designed). With teams averaging 1.8 points per game at home during the regular season and less than a point per game on the road during the regular season, these series would become largely “no contests” when that’s not what playoffs are supposed to be (my gut is that they would mirror the 11/12 play-in games going to the home team). Consider how few teams in MLS actually average more than 1.5 points per game (a favorable average) when playing away from home. Below is the full inventory of said teams over the past 5 years:
Also consider, how this stacks up to more traditional “Big 5 European Leagues” with traditionally less parity, in terms of percent of the league that averages 1.5+ ppg when playing away from home:
If no teams in your league can average a positive result when playing away, then why would you even hold a postseason in which every single round is laced with the most significant home field advantage observable in sports? It doesn’t make sense to me. Many out there want the team with the better record to be rewarded with an advantage in the playoffs. I understand this sentiment. After all, while playoffs are an exciting way to determine a league champion, the regular season should “matter” – especially in a sport like soccer, where the best leagues in the world determine their champion via a regular season table format. But my answer to these complaints is that first and foremost, the 2 best teams in each conference are absolutely rewarded something valuable, a bye – well earned rest, and the right not to be challenged by the 5th or 6th best teams in the conference. The third and fourth best teams are offered the significant homefield advantage vs the 6th and 5th best teams in the play-in rounds. But once we whittle the playoffs down to the top 4 teams in each conference, are we sure we want to try to reward incrementally different advantages to each of those 4 teams? In a league of parity and where the schedules aren’t balanced and New York Red Bulls and New York City FC have to play each other 3 times a year while Atlanta gets to face DCU (let’s not talk about it), if we were to award the 2nd best team a significant advantage over the 3rd place team in the East, would that even be fair? How certain would we be that the 2nd place team really earned this advantage? And as a reminder, the advantage given to the 2nd place team in this case would be massive based on the numbers mentioned above this post. From 2012-2016 in MLS, teams equivalent to the #4 seed in each conference average 1 point per game on the road against the league as a whole (including the basement dwellers of each conference). In short, it’s stacking the deck too much to let a team averaging 2.3 ppg at home (average top seed home record) host a team averaging 1 ppg on the road (avg #4 seed away record) and have this be the meat of your postseason (conference semi-finals and conference finals).
In summary, MLS created a league based mainly on the traditional American socialist-oligopoly high-parity sports model (NFL, NBA), and not on the free-market model (MLB, EPL, etc). In doing so, the league needs to accept that it values parity, and that having chosen a playoff-determines-champion model, the league needs to accept that it mainly* values the “what-happens-in-the-postseason-is-what-matters” concept. Those two ideas work decently well together, and the main benefit is that the playoffs are interesting because in most postseason games, they offer a visceral and tangible moment to distinguish two good teams that both want to be champion in a mostly just manner. While I understand that it feels right to give a team an edge for success it maintained over the long haul in the regular season, full homefield advantage in a single knockout game is too blunt of a tool to accomplish this, and further due to the nature of the league’s parity and the odd imbalanced scheduling, I’m not sure there’s much between 1-4 that would make me even want to dole out rewards/advantages in the playoffs between those teams. Just let the playoffs be what playoffs are supposed to be, taking the X number of best teams over the course of the year and facing them off against each other to determine who can come out on top when it matters most.
Postscriptum:
I realize that I didn’t address the MLS Cup Final being hosted by the higher seed as well as the play-in games being single elimination games hosted by the 3/4 seeds vs 5/6 seeds in each conference. For the record, it would be ideal to host the MLS Cup Final on neutral ground (like the Super Bowl), but I understand how ticket sales / tv optics impact this decision for a league that’s still trying to establish it’s place. It seems a necessary evil to me to make sure the Final is sold out and packed. Similarly, I think it’s fair to think of the 5th and 6th best teams in a conference as “wild cards” lucky enough to have made it into the playoffs (but also important that they’re allowed a path at all, given a league of high parity demands more teams be allowed entrance into the postseason).
Sorry for the team-agnostic content this time around. Will try to do a catch up post soon on recent ATL UTD matches… there’s just so many of them, and some of them are weird.
In the first ever soccer match at Mercedes Benz Stadium, Atlanta dominated the score sheet with a 3-0 victory and created their highest single game tally of expected goals (2.8 per ASA) this season. The team held FC Dallas to 0 goals and 1.2 expected goals (this spread is partly luck and partly Guzan). And the resulting 1.7 xGD is the highest winning expected goal difference for the club this season. All this points to dominance by the Five Stripes, and I think that’s probably fair. The box score suggests dominance as well:
However, I would say as a fan, I only felt comfortable in the second half. FC Dallas’ only two shots on target were two very good chances that Guzan had to make big saves for.
Green (SOT) early in 2H. Yellow (blocked) all in 1H.
And as dominant as Atlanta were in the end, those types of games will occasionally go south depending on the ordering of events and the direction of some bounces. I’ve included a map of all 5 of FC Dallas’ shots on target and blocked shots. They’re all very good chances, and would’ve altered events.
On the Atlanta side of things, 12 of 19 shots being put on frame is a high number (63% vs the league average 36%). The home side were exceedingly efficient at turning shots into #problems for Jesse Gonzalez. But as I recall, they were also much more efficient at turning attacks into shots (contrast this with away at Orlando where many counters and other attacking moves ended up just shy of registered shots). Whoscored has Atlanta at 27 touches inside the box, with an insanely high 8 firing within the 6 yard box. While a few of the 19 were from range, 19 shots on 27 touches inside the box feels pretty high to me – it feels *very* efficient. Because of all of this, I would not describe Atlanta’s 25% SOT conversion in this game as wasteful or as evidence of “sloppiness in the final third.” I would say the team were mostly lights out efficient in turning attacks into threats and threats into huge threats. Jesse Gonzalez stood on his head some, but at the same time, even while putting on massive shots and xG numbers, Atlanta still bested the 2.8 expected goals with 3 actual goals. I would say finishing was not a problem in this one.
That all being said, while it’s not surprising to hear very bullish talk of the team challenging for a top 2 spot in the east, along with talk that the wider and deeper playing surface has offered us a glimpse at a new normal for Atlanta where they will dominate every away side with pace and tenacity, (inhales) I expect we might see the team be slightly less efficient going forward at turning attacks into shots, slightly less efficient at turning shots into shots on target, and slightly more efficient at turning shots on target into goals (as has been the trend so far this year). I don’t feel too strongly about it. I’m just hesitant to think that what we saw against FC Dallas is what we’ll see going forward because of a bigger field and a slicker surface.
Pressing & Tidiness
These pressing numbers seem fairly standard for Atlanta with the exception that Dallas was slightly tidier than a typical Atlanta opponent. This may have been impacted by the severe game states of Atlanta leading for most of the game and increasing its lead as the game went on. Also both teams played more own-half passes than I’ve been seeing in these numbers. Atlanta’s 225 higher than its season average of 195, and FC Dallas’ 163 higher than Atlanta’s opponents’ average of 126. Perhaps this is the bigger pitch showing up, hard to tell. I thought Atlanta’s press was somewhat more ruthless than these numbers show with several balls won back quickly after a turnover, and quickly converted into through balls and other transition moves.
Atlanta’s defensive actions in the first half (left) and second half (right):
This is somewhat surprising given what I thought I observed which was a press that slowed somewhat in the second. I think in the second what you’re seeing is more counter-pressing — pressing to win the ball shortly after losing it to keep Dallas from countering.
Shape
We saw a return to the more pronounced back-3 shape with Larentowicz eager to join the other centre backs when in possession (LGP and Parkhurst in the left graphic, Jeff in the right).
Asad and Almiron seemed to connect over and over again with great effectiveness on the left. I can’t tell just yet if we should credit the larger pitch or not. It very well could have been the case that they each felt more comfortable on the ball with the defense stretched both laterally and vertically by the speed of Martinez and Villalba (and also Almiron). Jason Poon suggested that Atlanta and Almiron specifically targeted Dallas’ right back Grana. And that might very well have been the case. On the left below is the chalkboard for Garza + Asad, and on the right the map for Almiron, who does seem awfully left-leaning for a central playmaker. Asad drifts inward some but no more than usual. Anyhow, the key passes coming in from that side from these 3 players alone is … it’s high.
On the right side, there has been some criticism recently that the Garza/Asad dynamic of the fullback stretching the defense wide and the attacking midfielder tucking in wasn’t being replicated to the same degree of success. In this game however, I noticed Villalba tucking in often nicely into pockets between the lines to receive the ball. We don’t see the same degree of advancement from Walkes that we might see from Garza game to game, but the variety in attacking width on the right seemed to work well enough.
One last look at the attacking passes for each team. You can really see a contrast in style between the two. The first half below, Atlanta on the left and Dallas on the right:
FC Dallas obsessed with width. Atlanta just killing them from the most dangerous areas. In the second, it’s a little bit more varied as Dallas chased the game.
I’ll have to cut this one off now. Too many games.
In short, this game was a lot of fun. It’s possible the larger pitch is super-charging the team, but I want more evidence before we call that one. Atlanta was extremely efficient at turning attacks into shots, but Gonzalez was also a disruption. Guzan was very good. Atlanta good. Dallas bad.
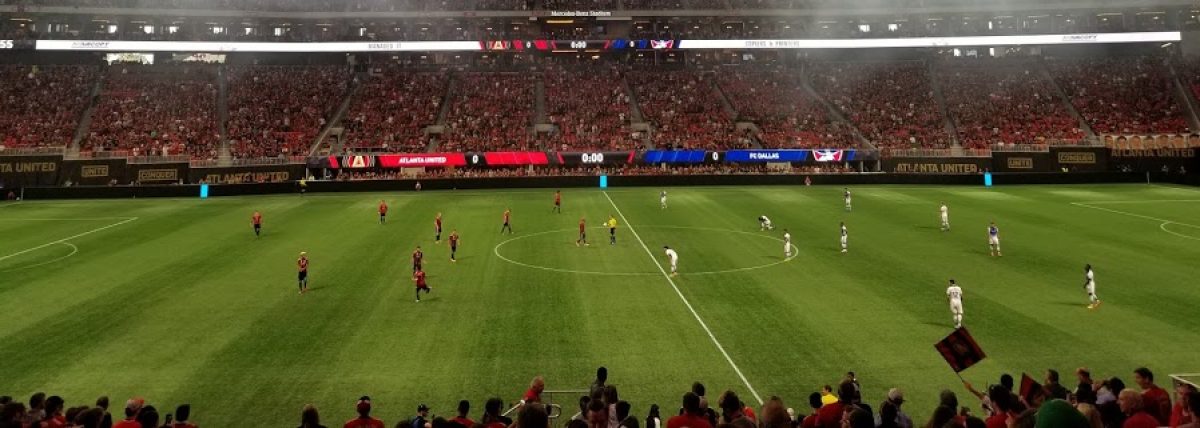

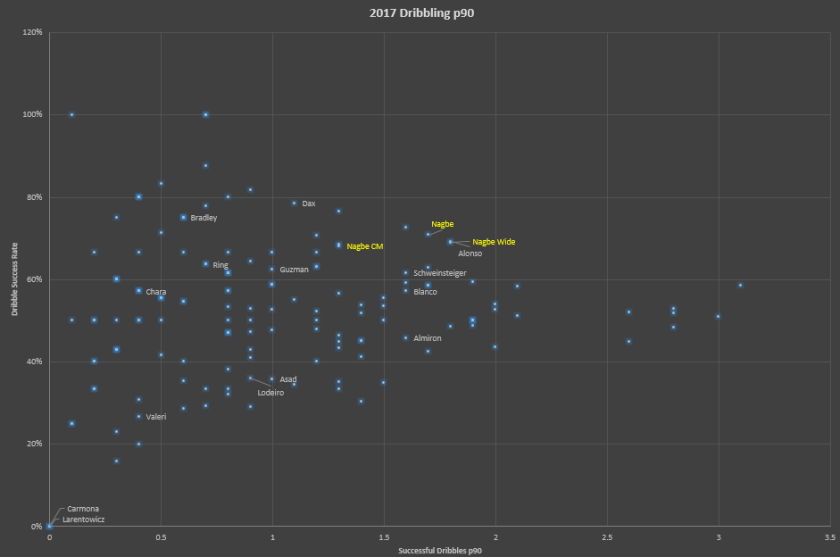
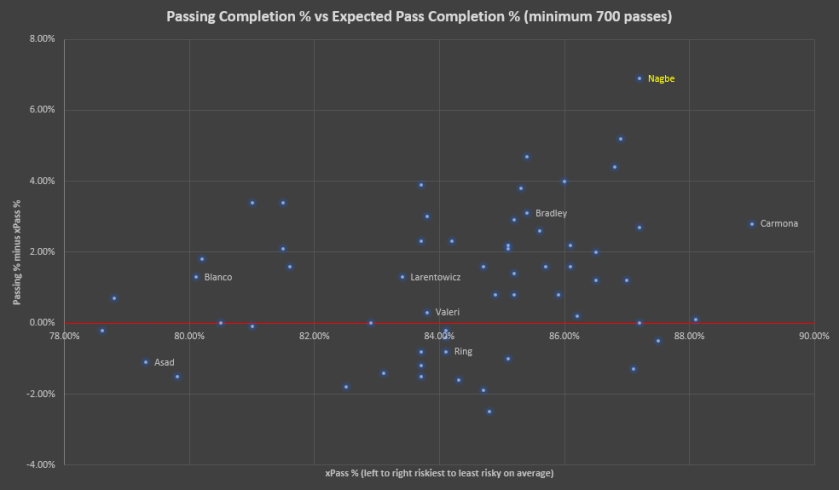
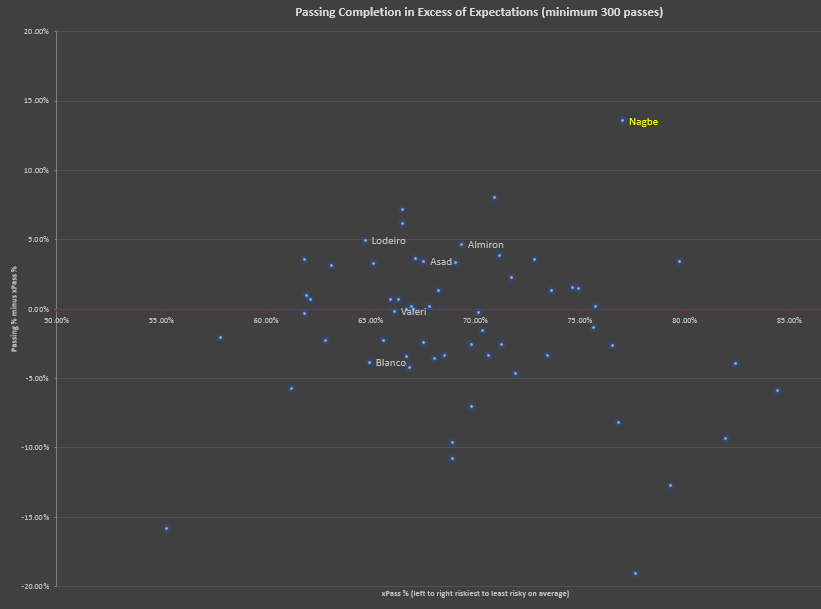
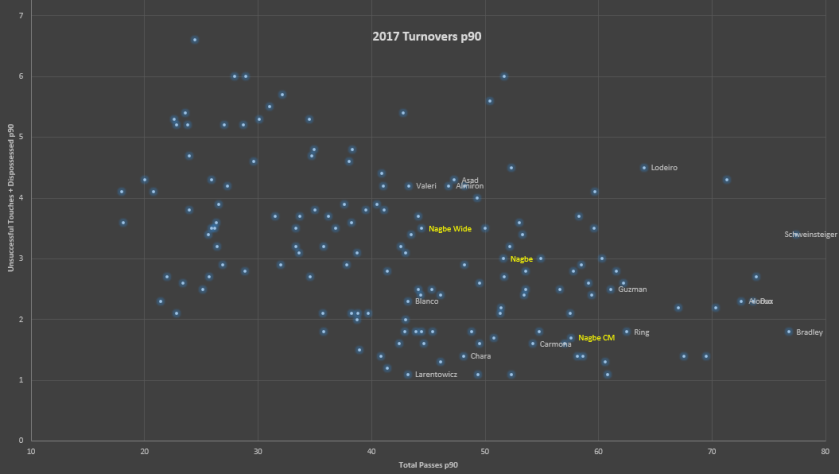
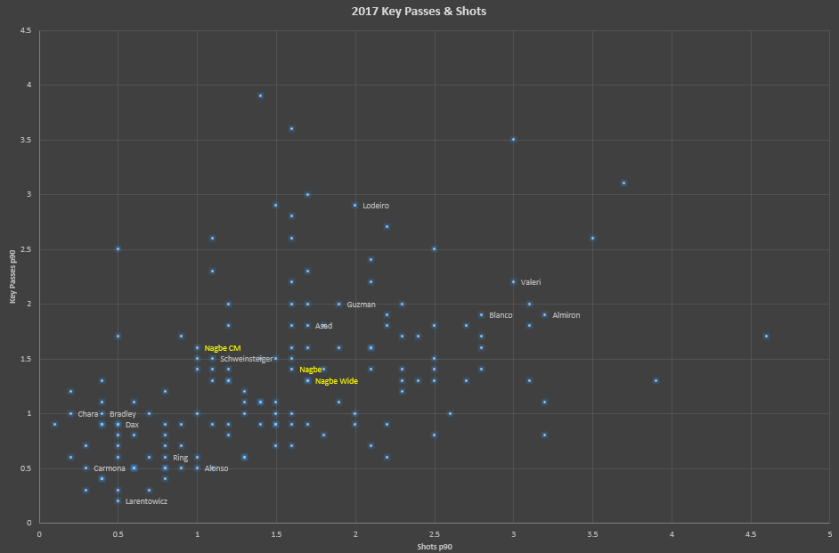
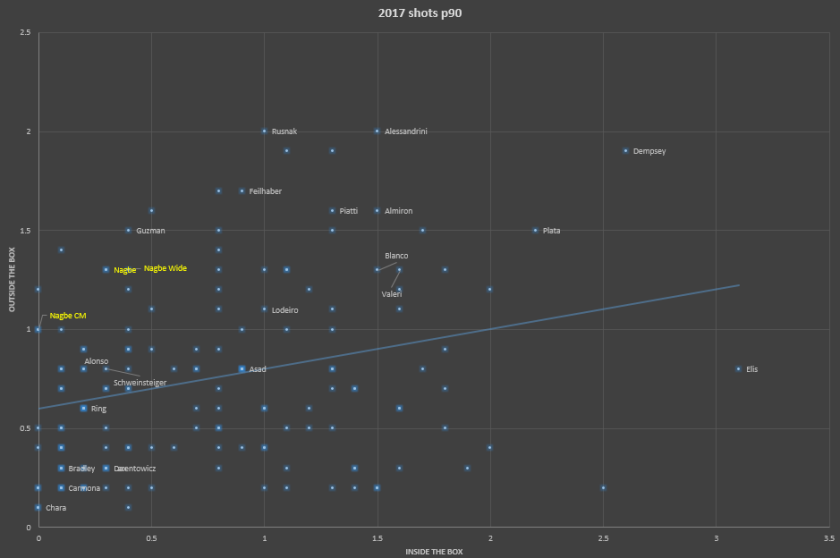
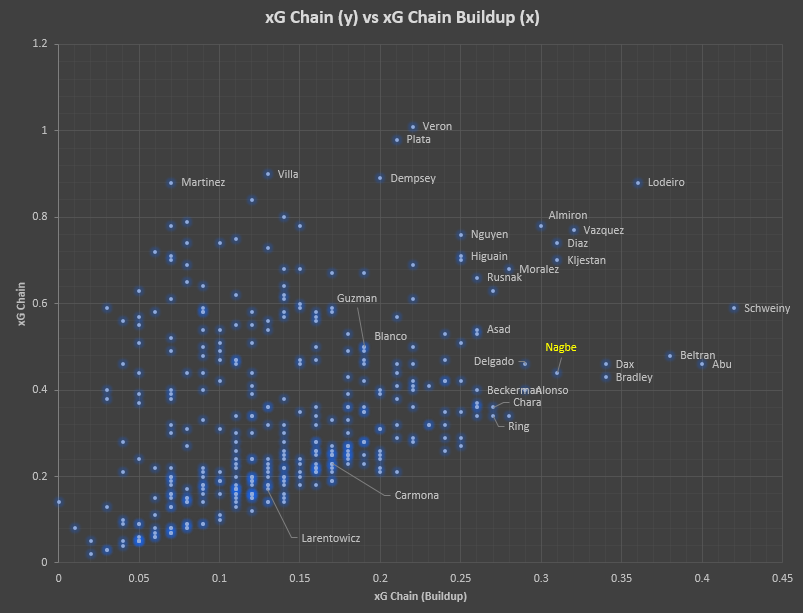
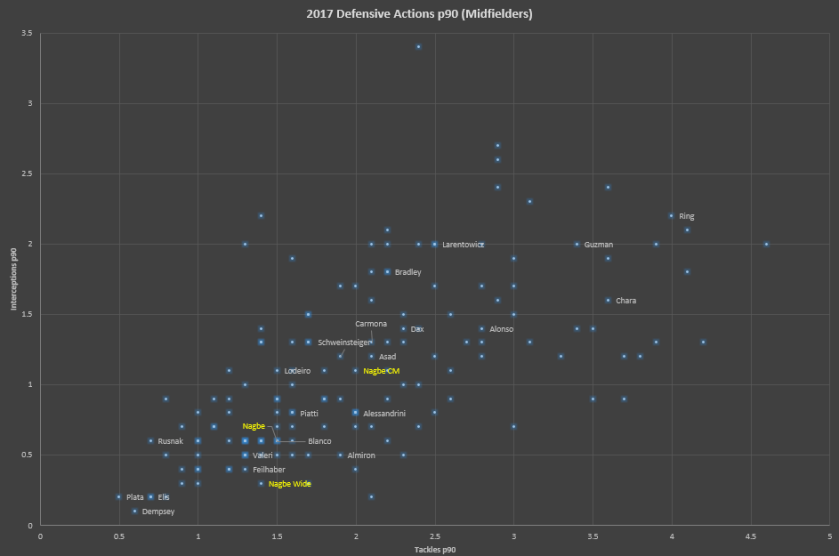
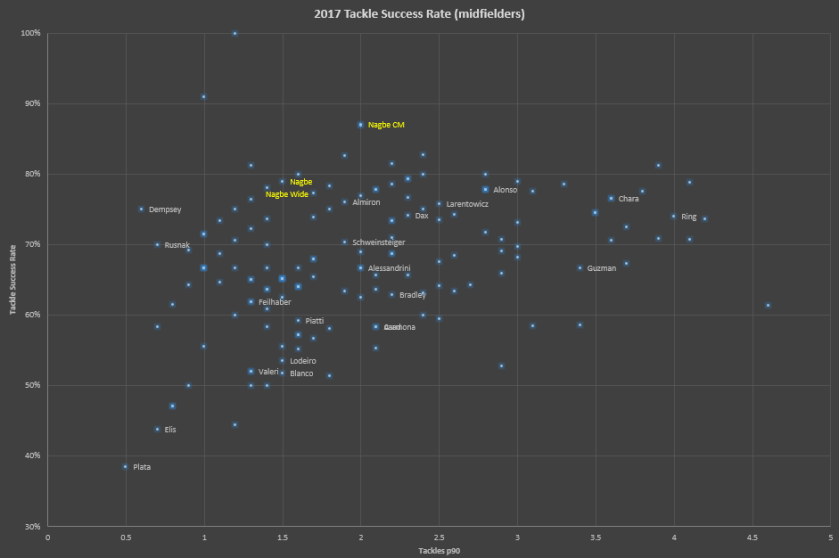

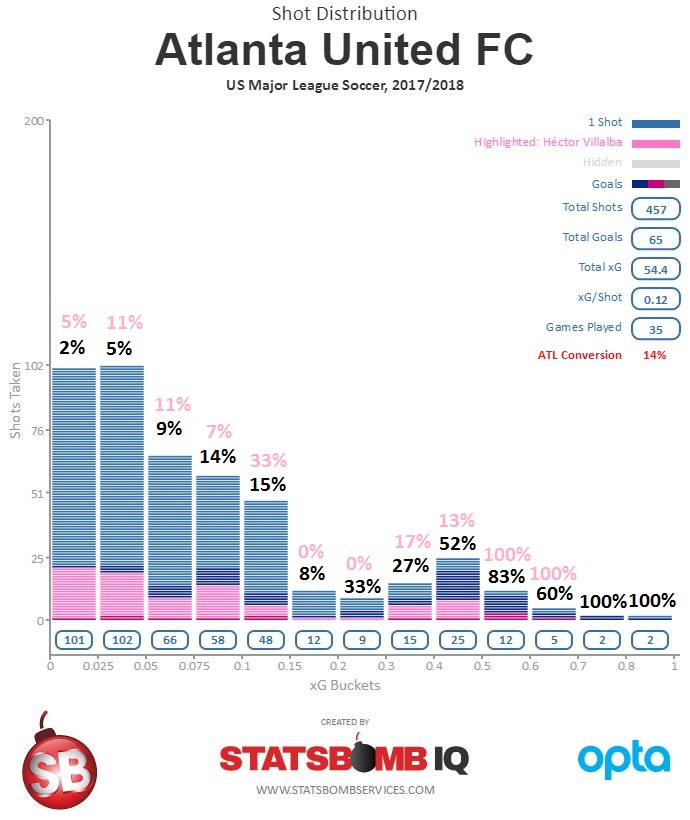
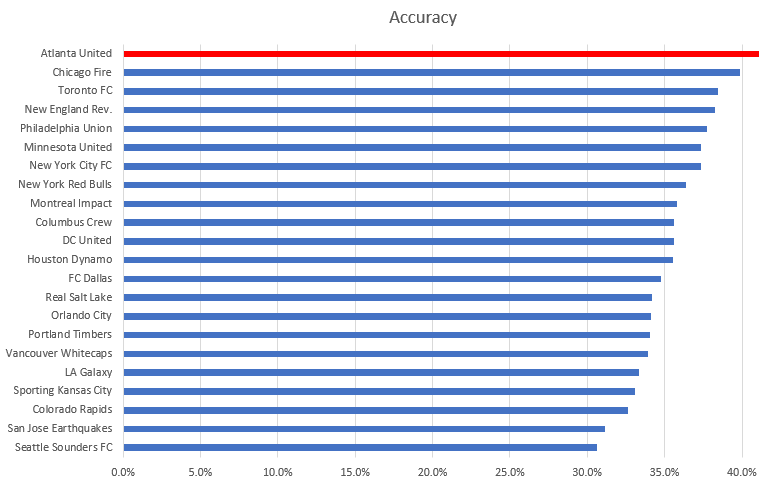
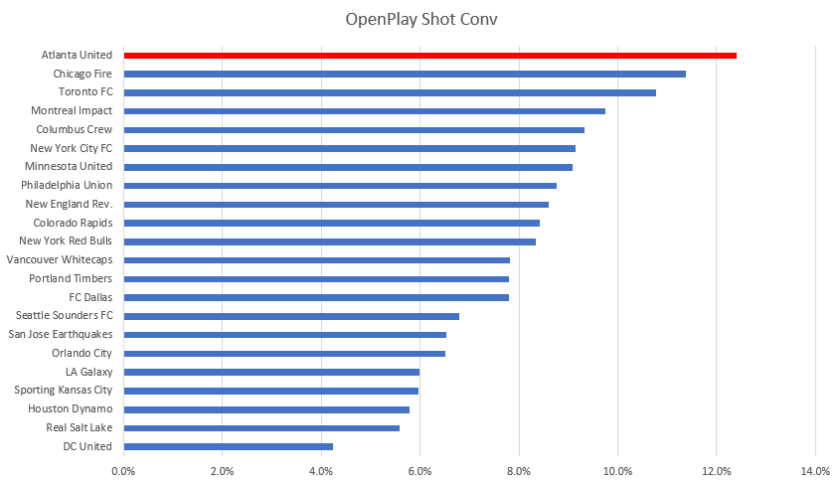
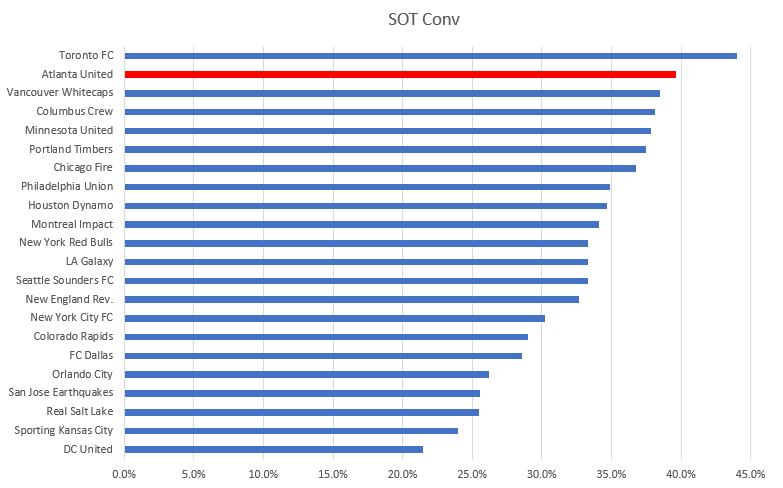
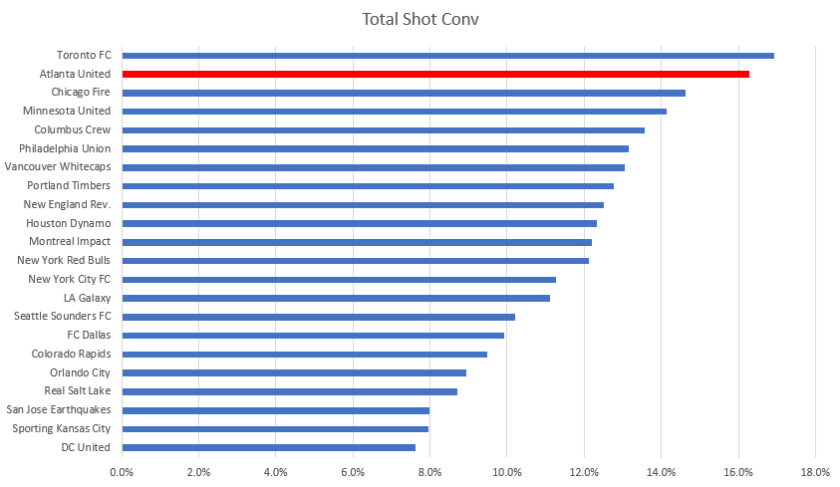
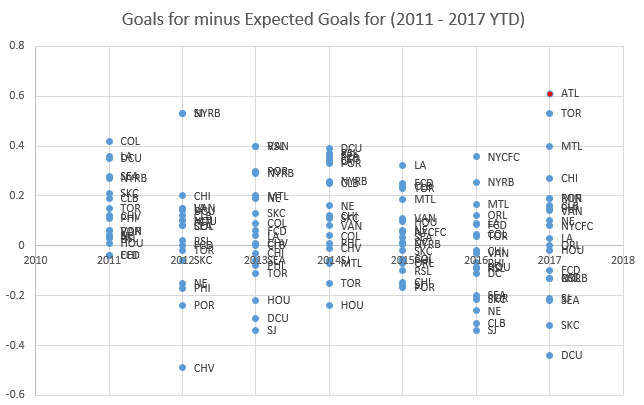

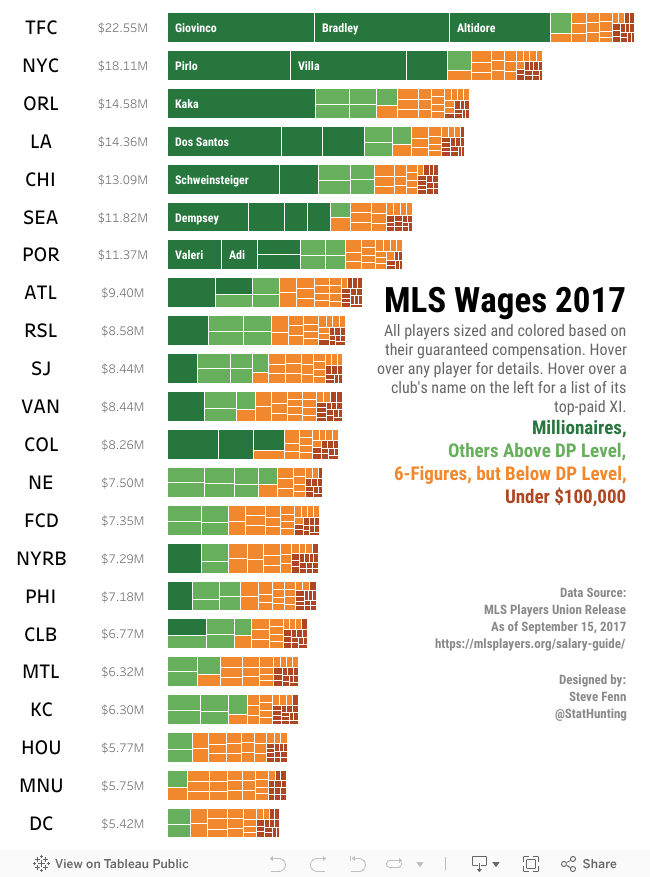
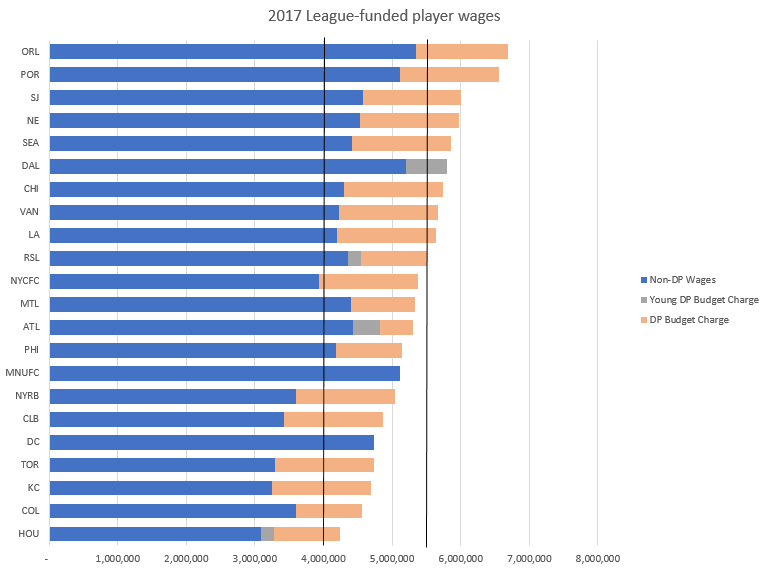
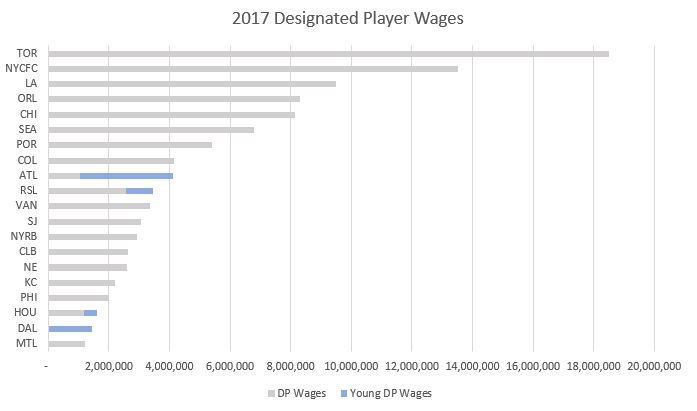
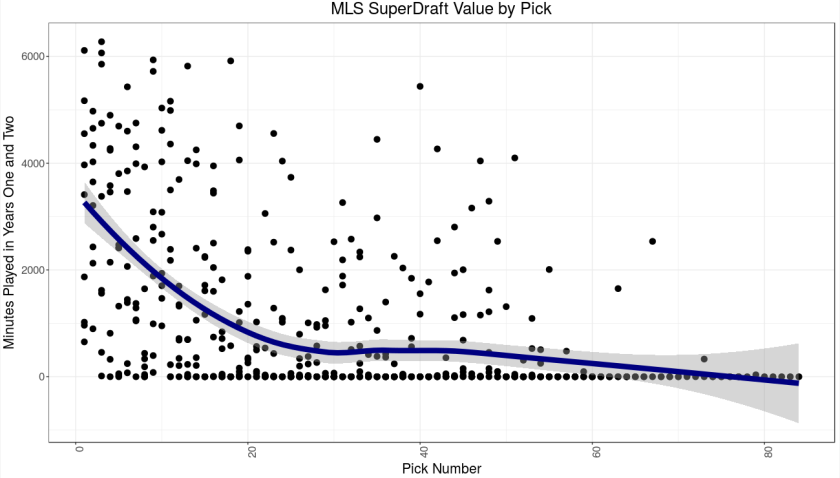
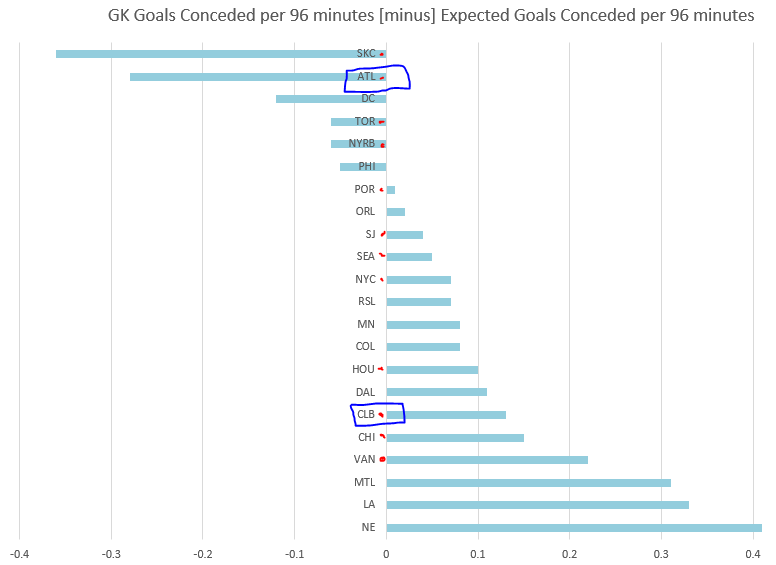
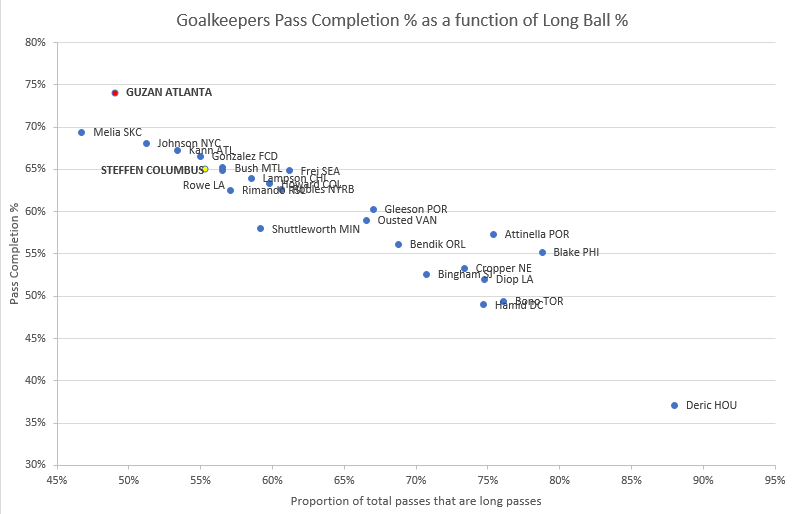
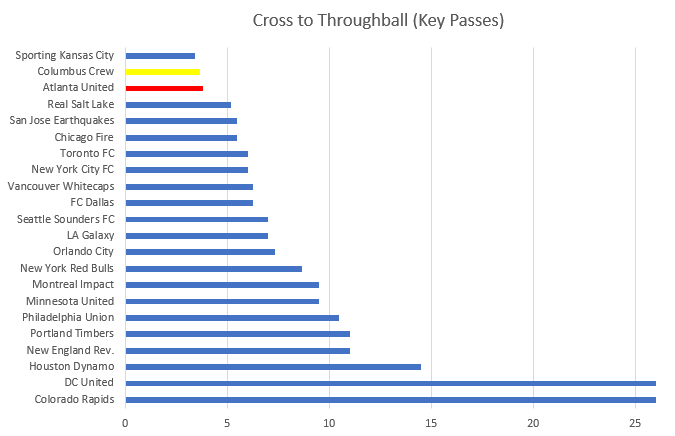
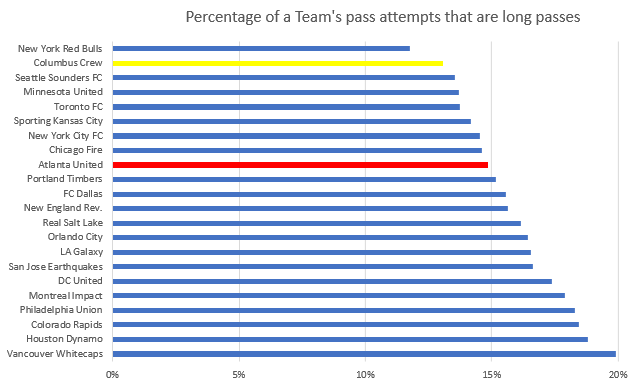
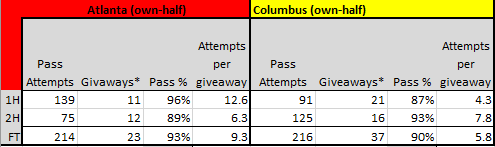
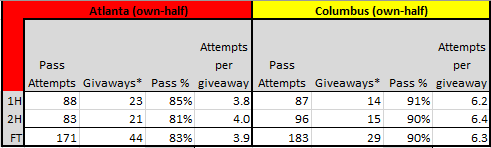
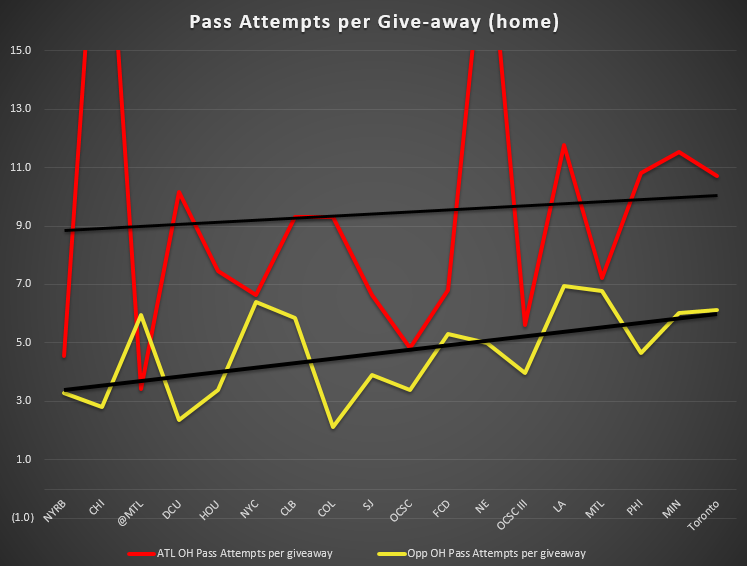 This all adds up to make me wonder if we are going to see the same sort of high pressure success on Thursday. This worries me as an ATLUTD supporter because I know the team is comfortable simply releasing the hounds of pressure.
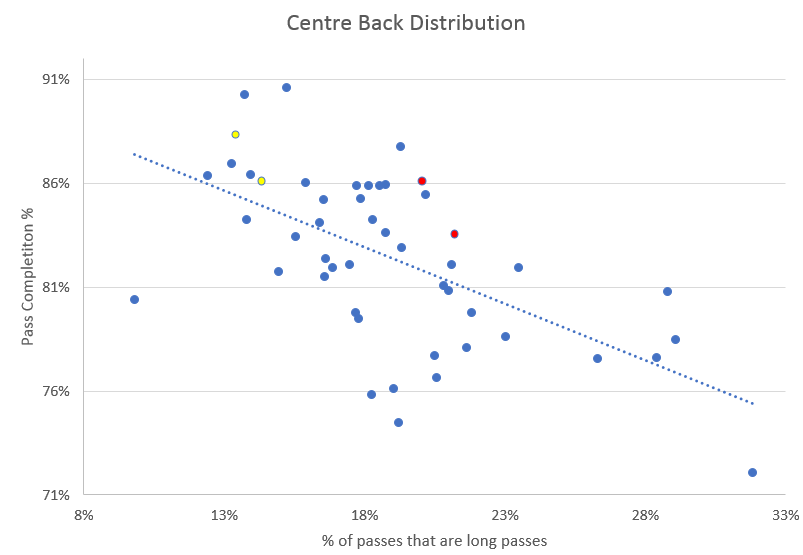
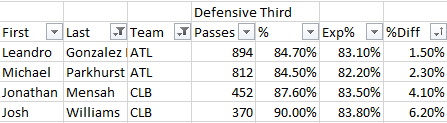
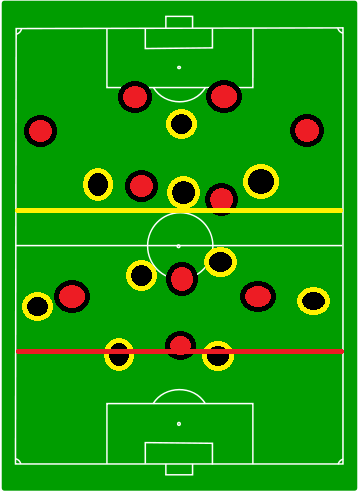
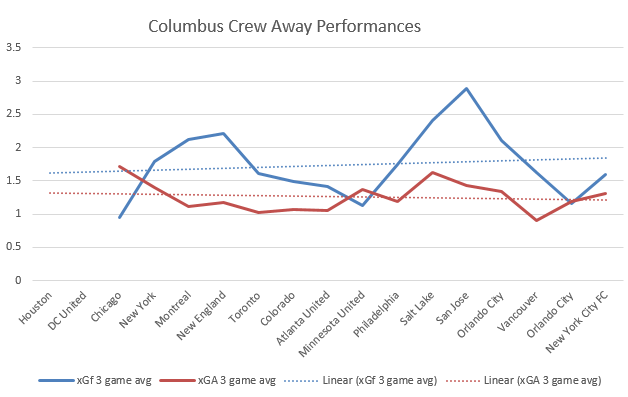
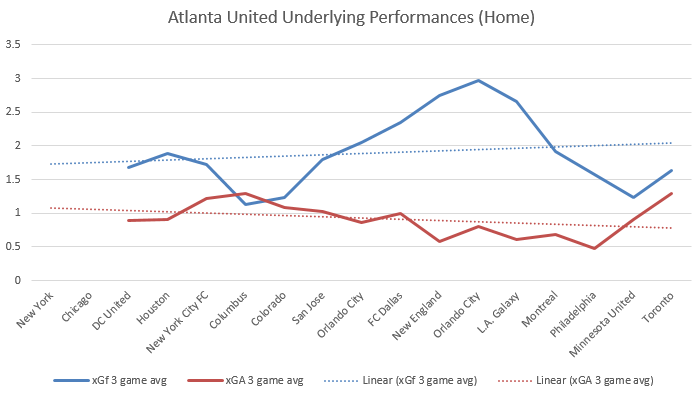
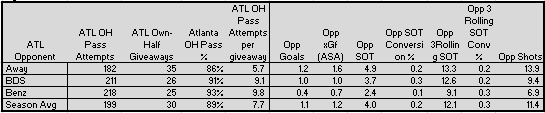
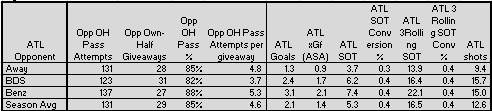
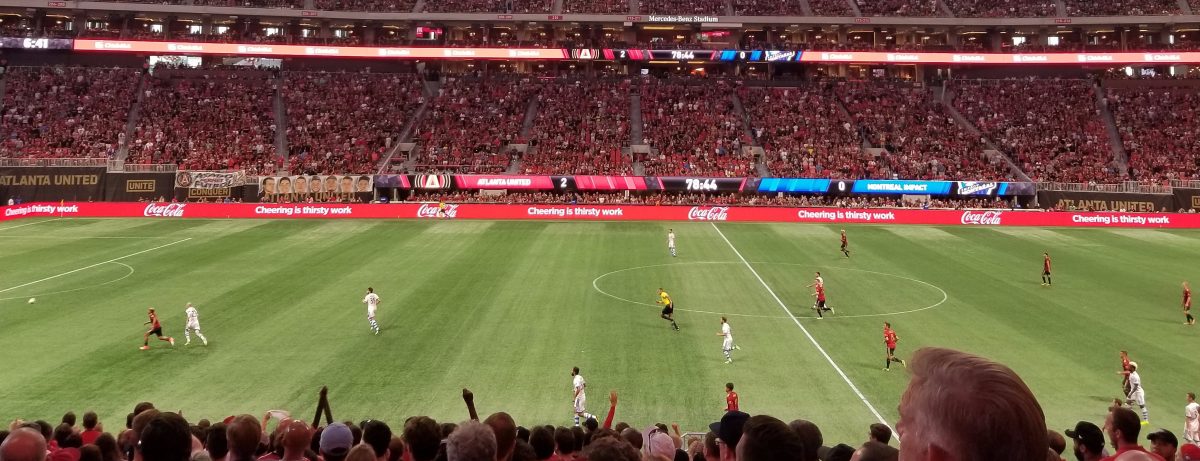
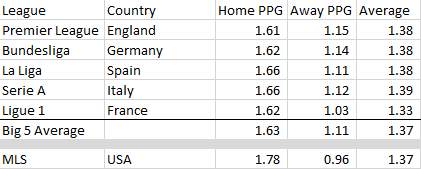
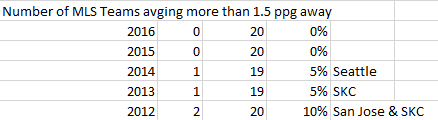
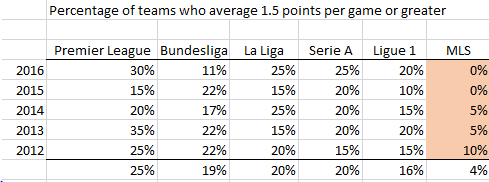
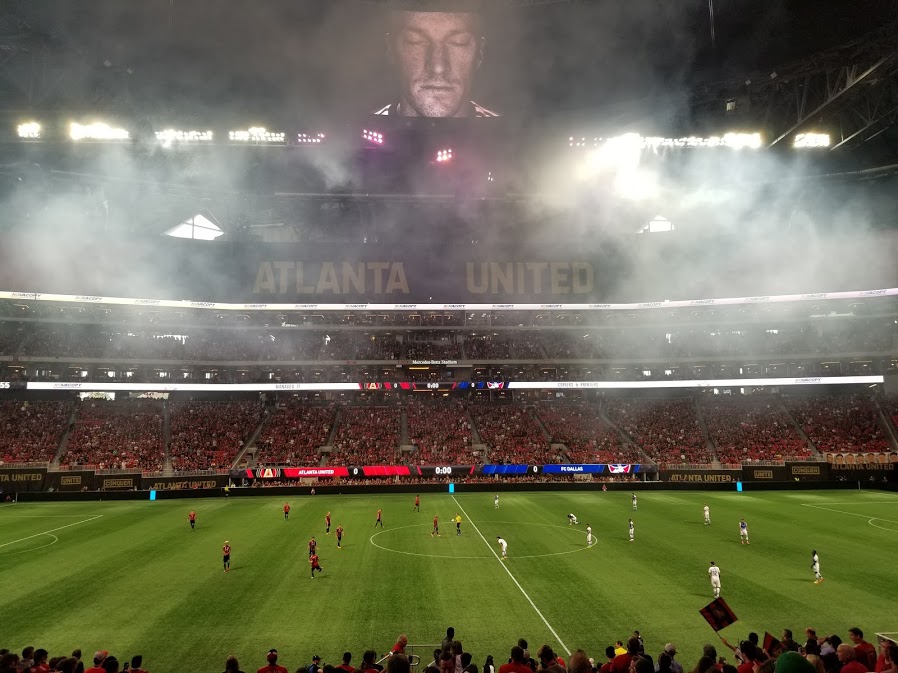
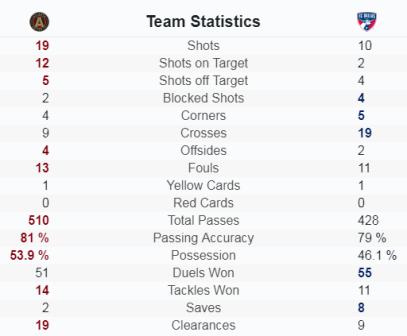
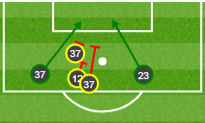
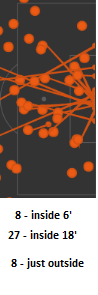 Whoscored has Atlanta at 27 touches inside the box, with an insanely high 8 firing within the 6 yard box. While a few of the 19 were from range, 19 shots on 27 touches inside the box feels pretty high to me – it feels *very* efficient. Because of all of this, I would not describe Atlanta’s 25%
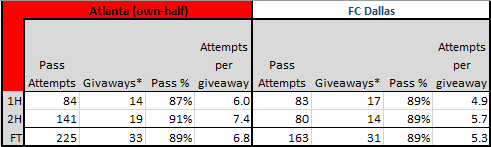


 On the right side, there has been some criticism recently that the Garza/Asad dynamic of the fullback stretching the defense wide and the attacking midfielder tucking in wasn’t being replicated to the same degree of success. In this game however, I noticed Villalba tucking in often nicely into pockets between the lines to receive the ball. We don’t see the same degree of advancement from Walkes that we might see from Garza game to game, but the variety in attacking width on the right seemed to work well enough.


